Join the conversation
We love to hear from our customers. Connect with us today and let’s start a conversation.
...searching
Tyre Thefts Across the UK Surge by Over a Quarter, FOI Data Shows.
Having your car tyres stolen isn’t just an inconvenience – it can leave your car undrivable, rack up unexpected costs, and even compromise tyre safety if replacements aren’t fitted properly. And for thousands of drivers across the UK, it’s a problem that keeps happening.
To find out where motorists face the biggest risks, we analysed five years of police force data from Freedom of Information (FOI) requests, alongside official crime statistics from ONS. This study looks at:
The findings don’t just point to long-term hotspots, they also reveal surprising new problem areas and some communities where tyre theft is spreading for the first time.
So, where are drivers most at risk, and what does it mean for motorists across the UK?
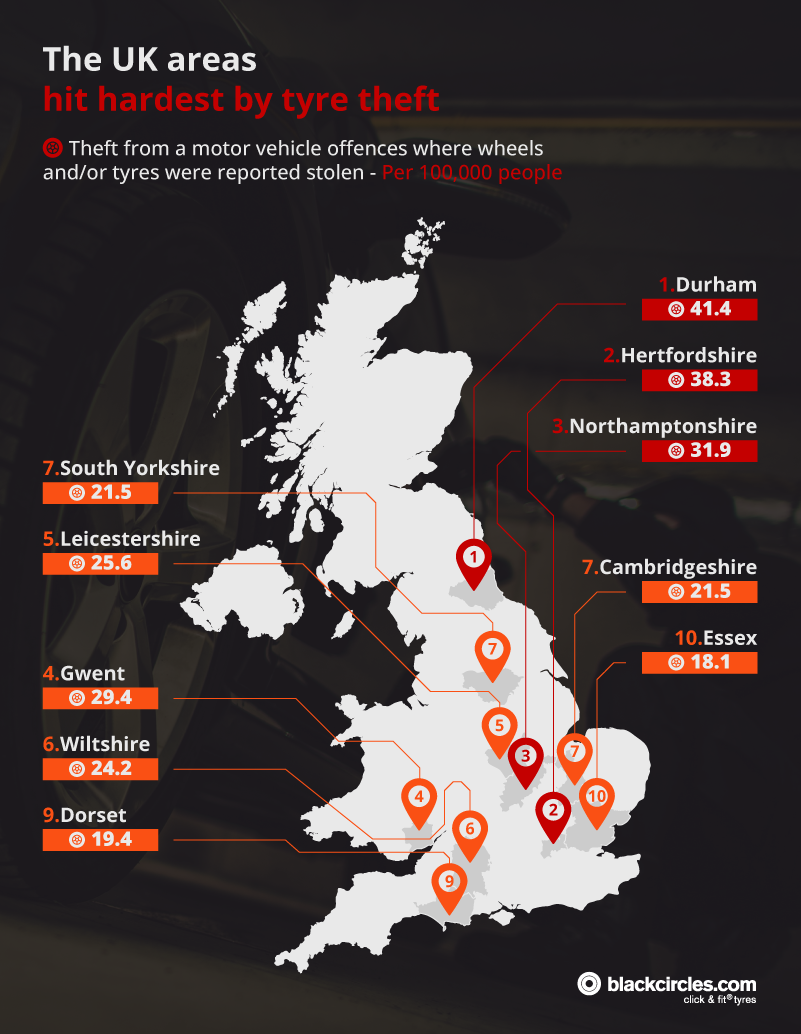
In some parts of the country, tyre theft has become so common that dozens of people return to find their cars left on bricks each year.
A mix of things could be influencing this, like cars being left on the street overnight in busier areas, the easy resale value of alloys and tyres, and even smaller areas (like Gwent) where fewer people means each theft has a bigger impact on the local rate.
| Rank | Police force area | Total | Per 100,000 people |
|---|---|---|---|
| 1 | Durham | 266 | 41.4 |
| 2 | Hertfordshire | 465 | 38.3 |
| 3 | Northamptonshire | 256 | 31.9 |
| 4 | Gwent | 175 | 29.4 |
| 5 | Leicestershire | 296 | 25.6 |
| 6 | Wiltshire | 183 | 24.2 |
| 7 | Cambridgeshire | 198 | 21.5 |
| 8 | South Yorkshire | 302 | 21.5 |
| 9 | Dorset | 153 | 19.4 |
| 10 | Essex | 343 | 18.1 |
Durham police recorded 266 tyre thefts between 2019 and 2024. Adjusted for population, that’s over 41 cases for every 100,000 people – the highest rate anywhere in the UK. This means the odds of losing a set of wheels are worse than in much bigger places like London or Manchester.
Hertfordshire has the highest total number of tyre thefts out of the top 10, with 465 incidents in five years – that’s almost two drivers every week seeing their wheels disappear. Adjusted for population, it’s around 38 thefts per 100,000 people.
Numbers peaked in 2020. That year alone saw 129 thefts, more than double the numbers recorded in 2022, 2023, or 2024. Even though cases dropped afterwards, they never fell away completely, leaving drivers dealing with a steady stream of incidents every year since.
In Northamptonshire, police logged 256 thefts between 2019 and 2024, equal to nearly 32 per 100,000 residents. While the totals aren’t as high as Hertfordshire’s, the risk here is still among the worst in the country.
The numbers have swung dramatically over that period. The peak came in 2019, when 91 thefts were reported. By 2022, the total had dropped to just 18 cases – the lowest point of the five-year stretch. Since then, thefts have crept back up, recently hitting 23 in 2024.
Tyre theft isn’t spread evenly across the UK. In some areas, it has been a persistent risk for years. In others, the numbers have started to climb more recently.
Looking at police force data between 2019 and 2024, which we obtained through our FOI requests, we can see both the places where thefts remain consistently high and the forces where cases are beginning to rise.
From our FOI data, there were 381 thefts in 2023 and 479 thefts in 2024; so there has been an increase of just over a quarter (25.7%).
Based on Freedom of Information responses from UK police forces, this figure reflects only the forces that provided data. Actual nationwide totals may be higher/lower.
No force reported more total tyre thefts than Hertfordshire Police, averaging 78 cases annually and peaking at 129 cases in 2020. Even when numbers dipped, they often stayed well above most other forces.
Other forces with stubbornly high figures include:
For anyone living in these areas, tyre theft isn’t rare. It’s something drivers have been dealing with year after year. Motorists are more likely to face the cost and hassle of replacing stolen wheels than almost anywhere else in the UK.
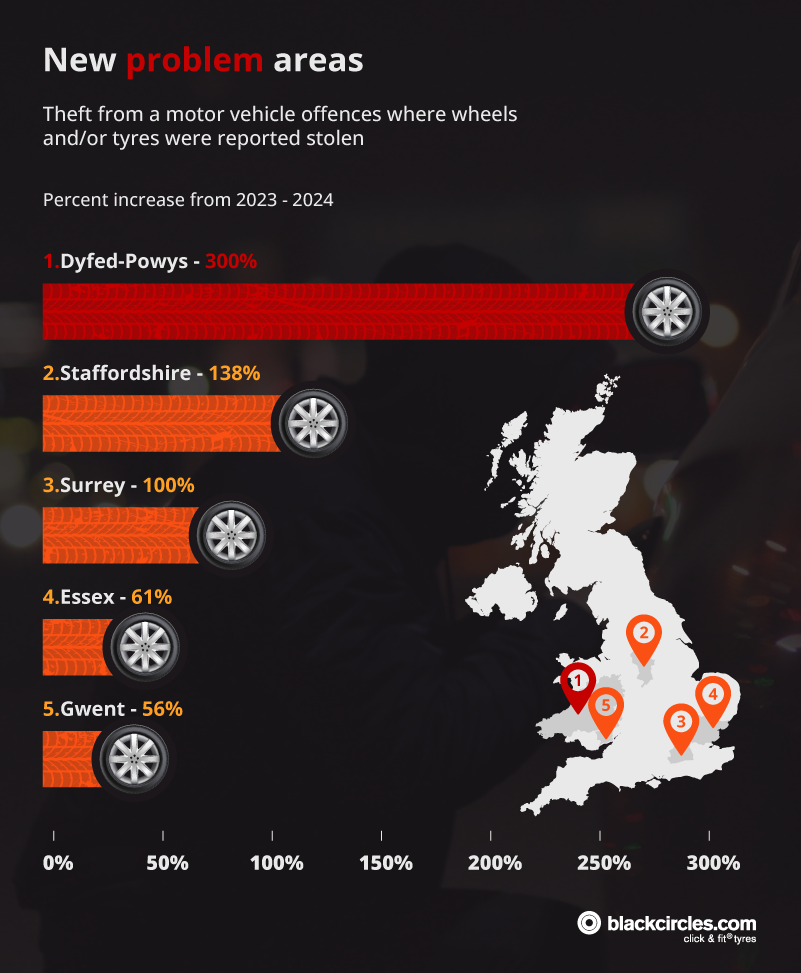
Looking at the most recent figures, some forces with relatively low numbers in the past are now seeing sharper rises.
| Rank | Police force area | 2023 | 2024 | Difference |
|---|---|---|---|---|
| 1 | Dyfed-Powys | 3 | 12 | 300% |
| 2 | Staffordshire | 21 | 50 | 138% |
| 3 | Surrey | 1 | 2 | 100% |
| 4 | Essex | 38 | 61 | 61% |
| 5 | Gwent | 18 | 28 | 56% |
| 6 | Kent | 32 | 49 | 53% |
| 7 | Cumbria | 4 | 6 | 50% |
| 8 | South Yorkshire | 38 | 56 | 47% |
| 9 | Suffolk | 11 | 14 | 27% |
| 10 | Nottinghamshire | 5 | 6 | 20% |
Dyfed-Powys recorded the biggest year-on-year jump, with cases rising from three in 2023 to 12 in 2024. While totals are still modest compared with the worst-affected areas, the sharp rise means drivers in rural Wales now face risks that were once uncommon.
Other forces experiencing recent growth in tyre thefts include:
While these aren’t the biggest numbers, they matter because they’re growing. In some forces, tyre theft was barely on the radar a few years ago, but now it’s starting to show up more often.
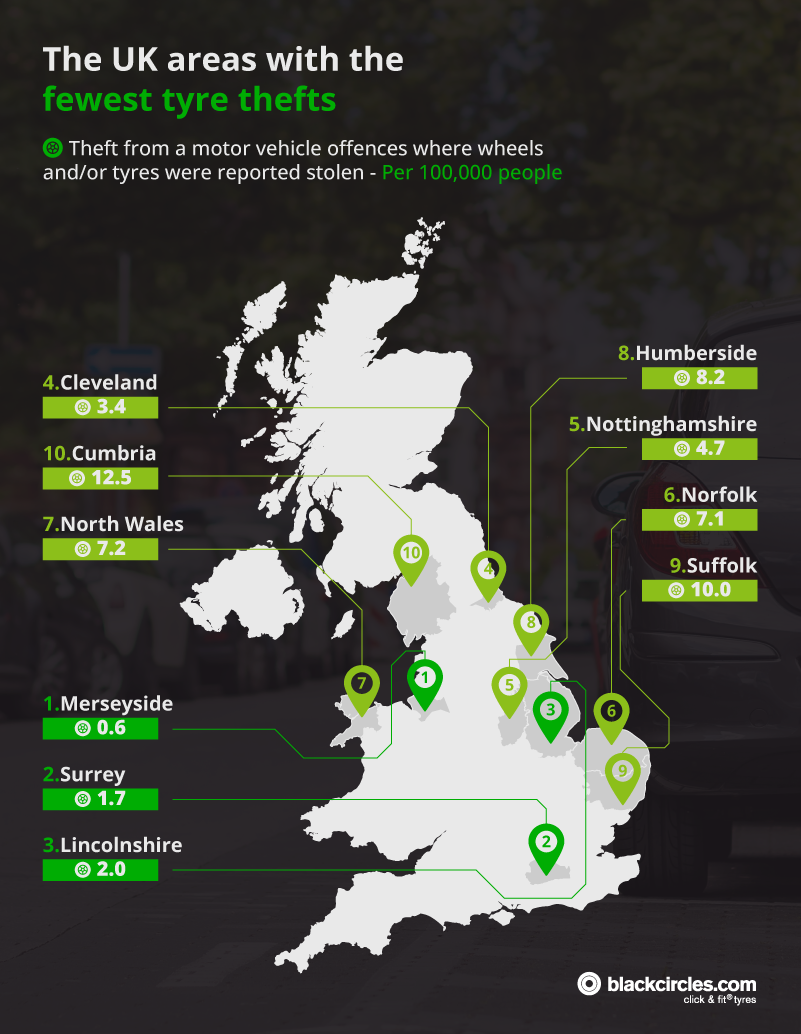
At the other end of the scale, some police forces report barely any tyre thefts at all.
Whether it’s down to local policing strategies, lower resale demand, or just geography making opportunistic theft harder, these places have the lowest rates of stolen tyres.
Merseyside recorded just nine tyre thefts between 2019 and 2024, which is 145 thefts lower than the national average. Adjusted for population, it equals just 0.6 thefts per 100,000 residents, by far the lowest rate in the UK.
That works out to fewer than two thefts a year, or roughly one every seven months, across the entire county. By contrast, for every incident in Merseyside, there were nearly 30 in higher-risk areas, such as Durham.
Drivers in Surrey also benefit from exceptionally low risk. Just 21 thefts were logged in five years – around 1.7 cases per 100,000 people. That’s an average of four incidents a year, or roughly one every three months.
Even in 2019, the busiest year on record locally with 12 thefts, totals were still tiny compared with national averages. To put that into perspective, Durham typically records more than that over just two months.
Lincolnshire police dealt with only 16 tyre thefts over the five-year period, equal to 2.0 per 100,000 people. In some years, totals were as low as zero, showing just how rare these crimes are in the county. By contrast, forces like Hertfordshire recorded 56 thefts during the same year.
Tyre theft is only part of the story. Across the country, thousands of drivers also face break-ins, stolen vehicles, and other crimes targeting their cars.
Looking at ONS figures on vehicle offences, we’ve found which communities have the highest rates overall.
| Rank | Community Safety Partnership | Vehicle offences per 1,000 people |
|---|---|---|
| 1 | Westminster | 20 |
| 2 | Kensington and Chelsea | 18 |
| 3 | Enfield | 14 |
| 3 | Camden | 14 |
| 5 | Waltham Forest | 13 |
| 5 | Haringey | 13 |
| 7 | Newham | 12 |
| 7 | Islington | 12 |
| 7 | Hillingdon | 12 |
| 7 | Ealing | 12 |

In Westminster, drivers face the highest rate of vehicle crime in the country: 20 offences for every 1,000 people. That’s one incident for every 50 residents in a single year.
Part of the problem could be visibility. Cars here are parked nose-to-tail on busy roads, with commuters, tourists, and residents all leaving their vehicles within easy reach of thieves.
Kensington and Chelsea isn’t far behind, with 18 offences per 1,000 people. It’s an area where high-value cars are common, which may explain why it attracts so many thieves.
It’s another borough where cars are packed tightly onto busy streets, making it easier for criminals to spot opportunities.
Enfield and Camden both see 14 vehicle offences for every 1,000 people, giving them the joint third-highest rates in England and Wales. On the surface, the two boroughs couldn’t be more different; yet the figures suggest car crime is thriving in both — from nightlife hotspots and stations in Camden to overnight residential parking in Enfield.
It isn’t always the areas with the highest totals that cause the most concern. In some parts of the UK, vehicle crime has been climbing fast, leaving drivers facing risks that were far lower just a year ago.
| Rank | Community Safety Partnership | Year-on-year change in vehicle offences |
|---|---|---|
| 1 | Powys | 70% |
| 2 | Melton | 64% |
| 3 | King's Lynn and West Norfolk | 60% |
| 4 | Ipswich | 46% |
| 5 | Conwy | 42% |
| 6 | Canterbury | 35% |
| 7 | Wellingborough | 31% |
| 8 | Carmarthenshire | 27% |
| 9 | Fenland | 26% |
| 10 | Fylde | 24% |
Powys saw the sharpest rise in the country, with vehicle offences jumping 70% in just a year. For a rural Welsh county that hasn’t traditionally seen high volumes of car crime, this is a big shift. While the raw totals are still lower than in larger urban areas – only one offence per 1,000 people in the most recent year – the pace of growth is a warning sign that car crime is no longer confined to big cities.
In Melton, offences climbed by 64% year-on-year, putting this small Leicestershire district among the fastest risers in England. Even modest totals (four incidents per 1,000 people) can have an impact when they rise this quickly.
King’s Lynn and West Norfolk experienced a 60% rise in vehicle offences in the space of a year, pushing this Norfolk district into the top three for growth. The figures suggest offenders are extending their reach into communities that previously felt outside the main hotspots.
Nyo Logan, Tyre Expert at Blackcircles, comments on how to protect your vehicle from thieves:
“Having your tyres stolen is one of those nightmares that can ruin your day in seconds. The good news is that there are some simple things you can do to deter thieves.
Start with where you park. A car left in a quiet corner or on a dark side street is an easy target, so pick a well-lit, busy spot whenever you can. If you’ve got a driveway, a motion-sensor light, or even a basic camera, it can be enough to make criminals think twice.
Locking wheel nuts are another easy way to protect your vehicle. They only cost a few pounds, but they need a special key to be removed. Changing a tyre with a locking wheel nut is almost impossible, meaning they can slow thieves down and often put them off altogether. Even small details help – like turning your wheels towards the kerb when you park, which makes it harder to access the bolts.
And finally, keep your eyes open. If you spot unusual activity in your neighbourhood, let the police know. Tyre theft often occurs in spates, so quick reports can stop a pattern from spreading.
Replacing wheels isn’t just expensive, it’s a hassle nobody needs. A few small habits can make a big difference to your chances of coming back to find your car exactly how you left it.”
Blackcircles is the UK’s leading online tyre retailer, helping drivers stay road-ready since 2001. Alongside a wide range of trusted tyre brands at competitive prices, our nationwide network of independent garages also offers MOTs and servicing, making it simple to book everything from new tyres to routine checks in one place.
As part of our commitment to keeping drivers informed and safe on the road, we analysed national and regional data to uncover where tyre theft is most common – giving motorists the knowledge they need to protect themselves and their vehicles.
On July 22nd, 2025, we submitted FOI requests to all UK police forces. Each force was asked to provide the number of “theft from a motor vehicle” offences between 1 January 2019 and 31 December 2024 in which wheels and/or tyres, including full wheel assemblies, individual tyres, or alloy wheels, were reported stolen.
Notes about the findings:
Not all forces were able to supply complete data. Some refused requests under Section 12 of the FOI Act (cost/time limit), while others provided partial data only.
Please note that results based on keyword searches are likely to undercount true totals, as they only capture mentions in summary fields and rely on consistent spelling and may not be fully comparable.
We also used
Office for National Statistics’ data tables to source vehicle offences per 1,000 people (Table C4) and the year-on-year change between the years ending March 2024 and March 2025 (Table C3) for each local authority in England & Wales.
All data was collected in September 2025 and is correct as of then.

We love to hear from our customers. Connect with us today and let’s start a conversation.