Join the conversation
We love to hear from our customers. Connect with us today and let’s start a conversation.
...searching
Motoring

Parking spaces might feel like they’re getting smaller, but it’s actually the cars that are getting bigger.
In fact, Blackcircles’ analysis shows that today’s models are, on average, 5.28% larger than they were 20 years ago, with dozens of popular vehicles now so long that they exceed the UK’s standard parking bay length of 4.8 metres.
That extra size doesn’t just make manoeuvring trickier; it also comes with added costs. Bigger cars require larger, more specialised tyres, and tyre prices themselves have risen by 48% since 2015, adding even more pressure to household budgets.
The growth of cars isn’t just affecting wallets. With vehicles now taking up more space, drivers have to contend with tighter bays, dinging doors, and the stress of squeezing into spots their older cars would have fitted into with ease.
To understand what’s going on, Blackcircles analysed historical and recent vehicle dimension data to see how much cars have grown, which models have expanded the most, and how the increasing size is affecting the cost of ownership.
Key findings:

Several modern cars now occupy more than 80% of a standard UK parking space, and six of the top ten models we analysed are actually longer than the bay itself.
Large SUVs and executive saloons in particular dominate the available footprint: vehicles such as the Land Rover Discovery and BMW 5 Series take up more than 80% of a typical 4.8m x 2.4m space, leaving drivers with far less room to manoeuvre.
This isn’t just a practical inconvenience; it increases the likelihood of scraped panels, tight exits and doors that can’t fully open, adding stress to everyday parking.
The models below represent the vehicles that consume the greatest share of a standard parking bay.
| Rank | Generic Model | Year | Length (mm) | Width (mm) | Area (mm²) | Percentage of Parking Space Taken |
|---|---|---|---|---|---|---|
| 1 | Land Rover Discovery | 2021 | 4,956 | 1,990 | 9,862,440 | 85.61% |
| 2 | BMW 5 Series | 2024 | 5,060 | 1,900 | 9,614,000 | 83.45% |
| 3 | Vauxhall Zafira | 2024 | 4,981 | 1,920 | 9,563,520 | 83.02% |
| 4 | Mercedes E Class | 2023 | 4,949 | 1,880 | 9,304,120 | 80.76% |
| 5 | Vauxhall Insignia | 2020 | 4,897 | 1,863 | 9,123,111 | 79.19% |
| 6 | Volkswagen Passat | 2024 | 4,917 | 1,849 | 9,091,533 | 78.92% |
| 7 | Audi A4 | 2020 | 4,762 | 1,847 | 8,795,414 | 76.35% |
| 8 | Honda CR-V | 2023 | 4,706 | 1,866 | 8,781,396 | 76.23% |
| 9 | Ford Kuga | 2024 | 4,604 | 1,882 | 8,664,728 | 75.21% |
| 10 | Mercedes C Class | 2021 | 4,751 | 1,820 | 8,646,820 | 75.06% |
The Discovery is not only the largest car on our list, but it has also seen sustained growth across its generations.
Since the early 2000s model (2003), its footprint has increased by around 550,000 mm², reflecting the documented shift towards heavier, tech-laden SUVs with more robust safety features.
That added size now means the latest Discovery fills over 85% of a standard UK parking bay (the most in our study), and exceeds bay length by nearly 20cm, making tight spaces, busy supermarket car parks, and older multi-storeys noticeably more challenging for drivers.
The BMW 5 Series is the longest car in our list and the only one stretching over five metres – over 20cm longer than the average parking bay itself.
Like its German counterparts, the
Audi A4, Volkswagen Passat, and
Mercedes-Benz E-Class, the
BMW 5 Series is an executive saloon car, designed to provide passengers with extra comfort and luxury compared to other vehicles.
Like the two other vehicles in our top three, the Vauxhall Zafira is nearly 20cm longer than standard UK parking spaces, and takes up over four-fifths (83%) of the entire space.
As an MPV, the Zafira has seven seats and is designed for family transportation, but it’s larger than other vehicles in its class, such as the Honda CR-V and the Kia Sportage.
This list examines historical vehicle data to illustrate the significant increase in car dimensions over the past couple of decades.
What’s striking is that the makes and models dominating the rankings today are largely the same ones that appeared at the top of the charts two decades ago.
This consistency reflects two key factors: the long-standing popularity of larger vehicles and manufacturers’ continued confidence in these models to sell well across multiple generations.
| Rank | Generic Model | Year | Length (mm) | Width (mm) | Area (mm²) | Percentage of Parking Space Taken |
|---|---|---|---|---|---|---|
| 1 | Land Rover Discovery | 2003 | 4,850 | 1,920 | 9,312,000 | 80.8% |
| 2 | BMW 5 Series | 2004 | 4,843 | 1,850 | 8,959,550 | 77.8% |
| 3 | Mercedes E Class | 2001 | 4,834 | 1,811 | 8,754,374 | 76.0% |
| 4 | Volkswagen Passat | 2005 | 4,780 | 1,820 | 8,699,600 | 75.5% |
| 5 | Land Rover Range Rover Evoque | 2011 | 4,371 | 1,900 | 8,304,900 | 72.1% |
| 6 | Ford Kuga | 2008 | 4,443 | 1,842 | 8,184,006 | 71.0% |
| 7 | Honda CR-V | 2001 | 4,535 | 1,785 | 8,094,975 | 70.3% |
| 8 | Skoda Octavia | 2004 | 4,569 | 1,769 | 8,082,561 | 70.2% |
| 9 | Vauxhall Zafira | 2005 | 4,468 | 1,801 | 8,046,868 | 69.9% |
| 10 | BMW 3 Series | 2004 | 4,520 | 1,780 | 8,045,600 | 69.8% |
Compared to the list of today’s cars, only three take up under 50% of the average parking space – the
Toyota Aygo,
Kia Picanto and
Hyundai I10 – emphasising the shift towards bigger vehicles.
Likewise, the cars in the 9th and 10th positions on this list use less than 70% of a standard parking space. In contrast, the same positions on our list of recent models use over 75%.
There are several reasons why our cars have grown so much over the last couple of decades, including:
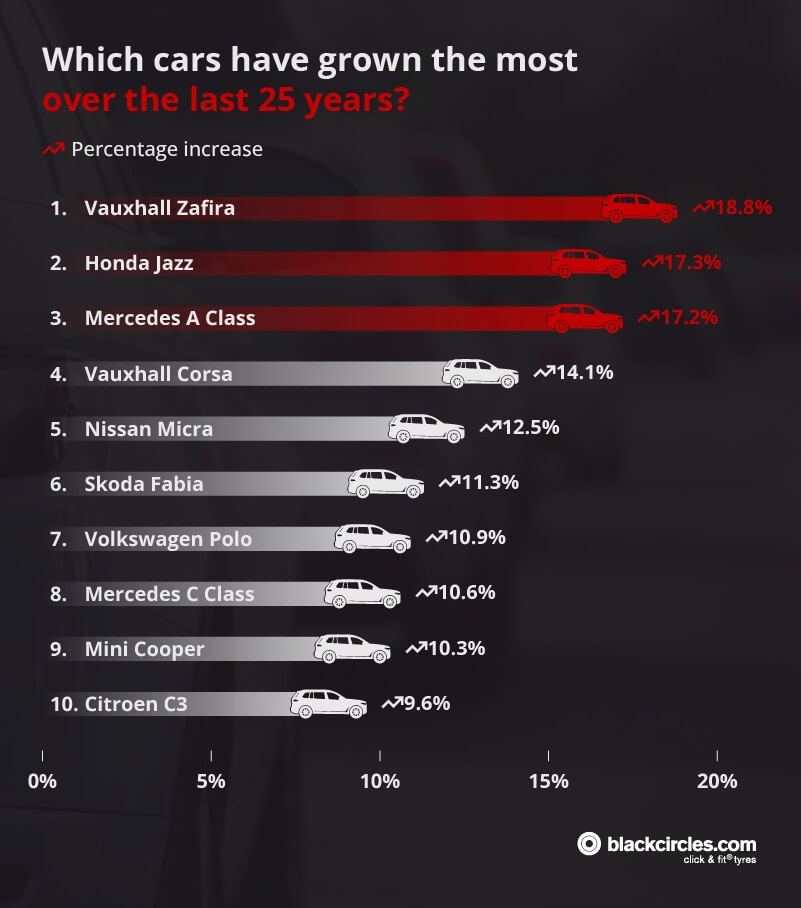
The table below highlights the cars that have seen the greatest increase in size over the past 25 years. Notably, it’s the smaller models that have expanded the most.
This growth is driven by a combination of factors, including stricter Euro NCAP safety requirements and rising consumer expectations.
Drivers now expect compact cars to offer the same levels of technology, comfort and practicality found in larger vehicles, from improved legroom and bigger boots to more substantial seating and onboard systems.
As a result, many superminis and small hatchbacks have grown by more than 10%, with models such as the
Volkswagen Polo and
Mini Cooper among those that have seen the biggest increases.
| Rank | Generic Model | Percentage Increase |
|---|---|---|
| 1 | Vauxhall Zafira | 18.8% |
| 2 | Honda Jazz | 17.3% |
| 3 | Mercedes A Class | 17.2% |
| 4 | Vauxhall Corsa | 14.1% |
| 5 | Nissan Micra | 12.5% |
| 6 | Skoda Fabia | 11.3% |
| 7 | Volkswagen Polo | 10.9% |
| 8 | Mercedes C Class | 10.6% |
| 9 | Mini Cooper | 10.3% |
| 10 | Citroen C3 | 9.6% |
The Vauxhall Zafira comes out on top in our list of the vehicles that have increased the most. This MPV has grown by almost 20%, including a nearly 12cm increase in width alone.
This reflects how family cars have shifted from lightweight people carriers to much heavier, safety-focused, tech-packed vehicles.
The
Honda Jazz has seen one of the biggest proportional growth spurts of any supermini. It’s now over 17% larger than the early models – a huge increase for a small car.
The Jazz is an example of how safety regulations and customer expectations have transformed smaller vehicles. To meet modern crash-test standards and fit hybrid systems, the Jazz has had to grow wider and longer, turning what was once a tiny runabout into a far more substantial small car.
The original Mercedes A Class was a city car, designed to be ideal for tight parking spaces and narrow streets. As a result, its shape was almost triangular, characterised by a shorter, more upright design.
Today, the A Class is a stylish hatchback with a longer bonnet and an infotainment system, which adds to its weight and design; therefore, it’s no surprise that it has grown by over 17%.
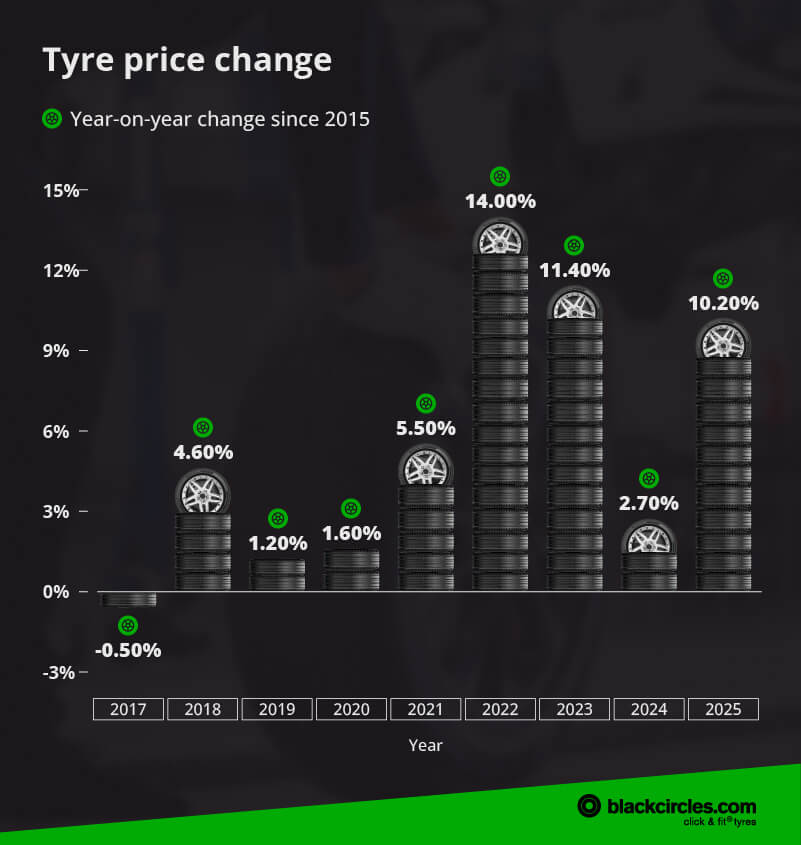
It’s not just the cars themselves that have grown. As vehicles have become larger and heavier, many of their components have also increased in size, including tyres.
While modern tyres are designed to support improved safety, performance and efficiency, they’ve also become significantly more expensive.
Tyre prices have surged in recent years, driven by a combination of global supply chain disruptions, rising energy costs, and higher raw material prices. The result is a substantial increase in the cost of routine maintenance for many drivers.
| Year | Percentage Increase Since 2015 | Year-on-Year Change |
|---|---|---|
| 2016 | -2.4% | - |
| 2017 | -2.9% | -0.50% |
| 2018 | 1.7% | 4.60% |
| 2019 | 2.9% | 1.20% |
| 2020 | 4.5% | 1.60% |
| 2021 | 10.0% | 5.50% |
| 2022 | 24.0% | 14.00% |
| 2023 | 35.4% | 11.40% |
| 2024 | 38.1% | 2.70% |
| 2025 | 48.3% | 10.20% |
Over the last 10 years, tyre prices have increased by almost 50%, with the largest increases occurring after 2021.
In fact, before 2021, they had only climbed 4.5%, with the years 2016 and 2017 even seeing a decline.
After 2021, however, it’s a very different story, with a steep increase in 2022 (14%) and a further 11.4% in 2023. In fact, tyre prices grew by over 30% in the years 2021-2023.
Several factors have influenced these prices, including inflation, oil price volatility, and the higher cost of energy, which is partly due to political tensions in Eastern Europe.
It wasn’t just tyre costs that increased during this time. Other car parts, repairs and
car servicing costs were all impacted as the cost of living crisis hit the UK hard.
This trend also somewhat reflects the idea that cars are getting bigger, too. Bigger cars require larger tyres, which increases their prices.
As we saw in the previous graph, even smaller cars have become significantly larger over the last 20 years.
A push towards electric vehicles is another key factor to consider. EVs are heavier than petrol or diesel cars, meaning the tyres need to have higher specifications and stronger sidewalls, which all come at a premium.
Expert comment:
Jay Kennedy, Tyre Expert at
Blackcircles, comments on…
“Our analysis and data show that tyre prices have risen by almost 50% since 2015, with the steepest increases coming after 2021. This reflects a shift in the cost of living and, more specifically, the overall cost of motoring.
“For drivers, this means
MOTs and car services can cost significantly more. However, it’s crucial that drivers do not delay tyre replacement for cost-saving reasons. In fact, as cars are getting heavier and tyre wear increases, keeping an eye on tyre condition has never been more important.”
To keep tyre costs down, drivers should:
Blackcircles is the UK’s leading online tyre retailer, helping drivers stay road-ready since 2001. Alongside a wide range of trusted tyre brands at competitive prices, our nationwide network of independent garages also offers MOTs and servicing, making it simple for customers to book everything from new tyres to routine checks in one place.
To understand how much cars have increased in size over the last 25 years, and the impact this has had on tyre sizes and costs, we analysed the most common vehicles on UK roads and compared the dimensions of their earliest post-2000 models with their latest versions.
We then examined how these changes relate to the amount of space cars now occupy and how tyre prices have risen over the same period. The full methodology is outlined below.
We began by using the UK
Government’s Vehicle Licensing Statistics dataset (df_VEH0120_UK) to identify the most common cars on the road by generic model. This allowed us to create a representative seeding list of vehicles for analysis.
Next, we sourced the dimensions of the latest versions of each car in our list from
https://www.automobiledimension.com/, recording the stated length and width for each model.
To compare these with older vehicles, we used Wikipedia to find the length and width of the first generation of each car released after the year 2000. On both sources, vehicle widths exclude wing mirrors, and all measurements are provided in millimetres.
Using these dimensions, we calculated the area occupied by each vehicle and determined how much of an average UK parking space is used by each one. A standard UK parking bay measures 4.8 metres in length and 2.4 metres in width.
Finally, to examine how tyre prices have changed over time, we used the
Office for National Statistics dataset to identify the percentage increase in tyre costs since 2015.

We love to hear from our customers. Connect with us today and let’s start a conversation.