Join the conversation
We love to hear from our customers. Connect with us today and let’s start a conversation.
...searching

The UK has approximately 2,300 miles of motorway crisscrossing the land, allowing people and goods to travel from city to city at high speed.
Over most British drivers' lifetimes, they will travel thousands of miles on the motorway network, and the vast majority of them will be without incident.
As we approach the holiday season, there will be more drivers on the road than at most times during the year, so it is extra important for drivers to stay vigilant.
Motorways are the safest type of road in the UK, as despite the higher average speeds, there were only 84 deaths on motorways in 2023 compared to almost 1,000 on rural roads1.
But which motorways are the safest and most hazardous? The experts at Blackcircles have studied several factors to find out.
On top of this, the most common cause of traffic collisions on motorways has been revealed, identifying what drivers should be wary of to stay safe on the motorway, from aggressive driving, blown-out car tyres, and weather conditions.
To discover the safest motorways, we analysed the average number of vehicles per day, collision rates per kilometre, average speeds, and journey delays across the motorway network to discover which stretches are the safest and most reliable.
Whilst the majority of motorway drives pass without incident, some routes consistently produce more safety concerns than others. The data shows that regional motorways, with lighter traffic, tend to offer shorter drives.
Across all the motorways in England and Wales, there is an average of one collision per kilometre of motorway, an average speed of 58 mph, and an average delay of 11 seconds per vehicle per mile.
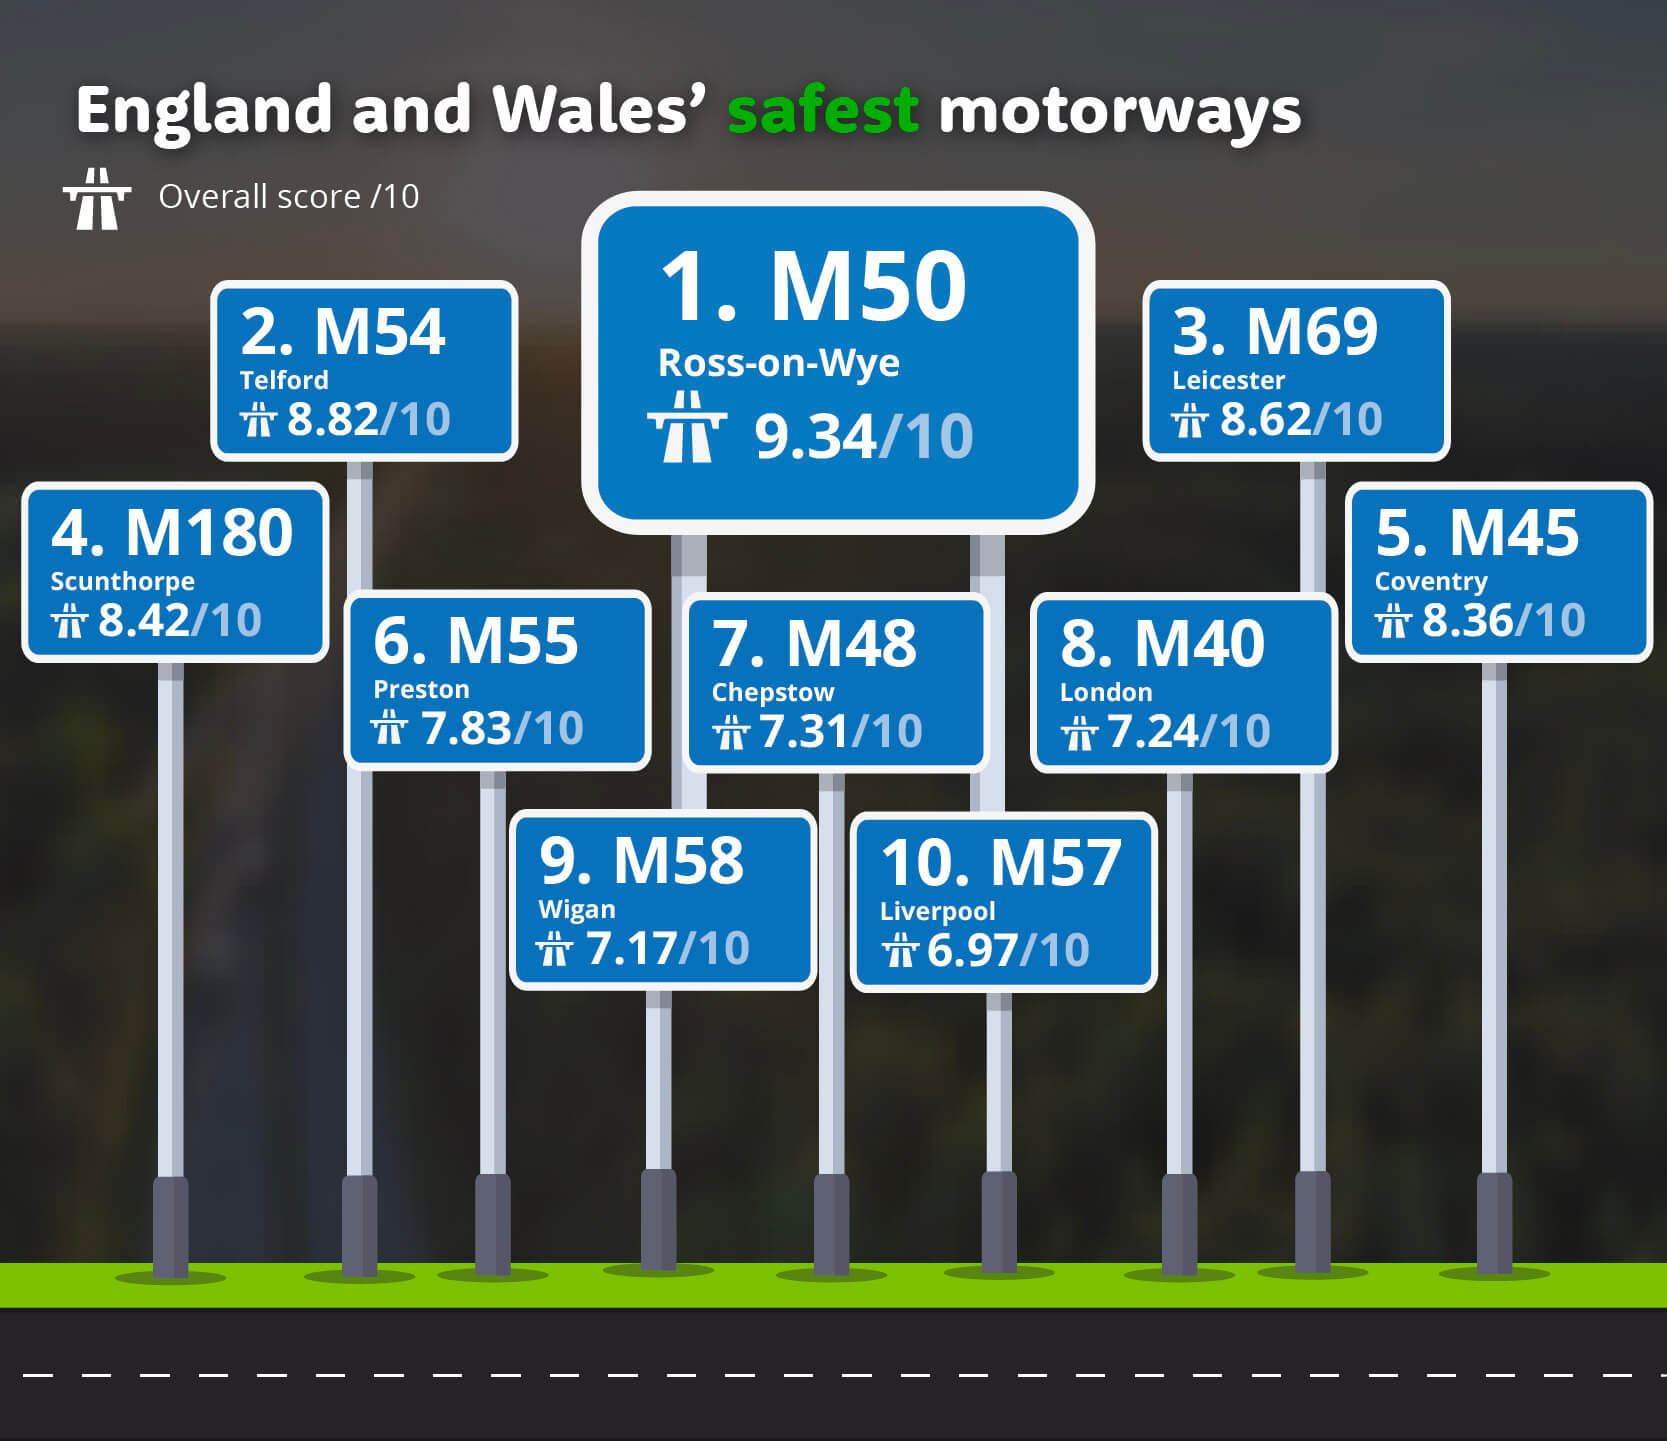
| Rank | Motorway | Average vehicles per day | Collisions per km of motorway | Average speed (mph) | Average delay (seconds per vehicle per mile) | Overall score /10 |
|---|---|---|---|---|---|---|
| 1 | M50 | 25,006 | 0.3 | 66.2 | 3.5 | 9.34 |
| 2 | M54 | 45,076 | 0.3 | 65.7 | 3.7 | 8.82 |
| 3 | M69 | 52,835 | 0.4 | 66.3 | 3.7 | 8.62 |
| 4 | M180 | 35,539 | 0.3 | 62.7 | 6.1 | 8.42 |
| 5 | M45 | 14,472 | 0.2 | 62.1 | 6.7 | 8.36 |
| 6 | M55 | 54,712 | 1.0 | 67.1 | 2.8 | 7.83 |
| 7 | M48 | 16,514 | 0.4 | 60.5 | 8.2 | 7.31 |
| 8 | M40 | 85,969 | 0.6 | 66.3 | 3.5 | 7.24 |
| 9 | M58 | 37,263 | 0.8 | 62.4 | 6.9 | 7.17 |
| 10 | M57 | 58,771 | 0.8 | 62.5 | 6.0 | 6.97 |
The M50 is a short motorway which connects Ross-on-Wye on the Welsh border to the larger M5 near Tewksbury. This short distance means there are an average of just 25,000 vehicles on the road per day, 40,000 fewer than the national average, making it one of the quieter motorways by this metric.
There are just 0.3 collisions per kilometre of the motorway, one of the lowest rates in the country, well below the average of one per km; as well as the second-lowest delay per vehicle per mile anywhere in the country (3.5 seconds).
Another very safe motorway is one of the shorter ones, the M54 in the West Midlands. Despite 20,000 more vehicles travelling on the M54 per day, there was the same number of collisions per km as the M50 (0.3), but a slightly longer average delay (3.7 seconds per vehicle per mile).
The M69, which connects Leicester and Coventry, is the third safest motorway in the country. There are just 0.4 collisions per km, well below the national average of one, bucking the trend of a commuter road being one of the most dangerous. A high average speed of 66.3 mph and a low average delay of 3.7 seconds per vehicle per mile suggest a good traffic flow, which could contribute to fewer accidents.
In contrast to the safest motorways, some are far more hazardous than the national average, as measured by the same metrics.
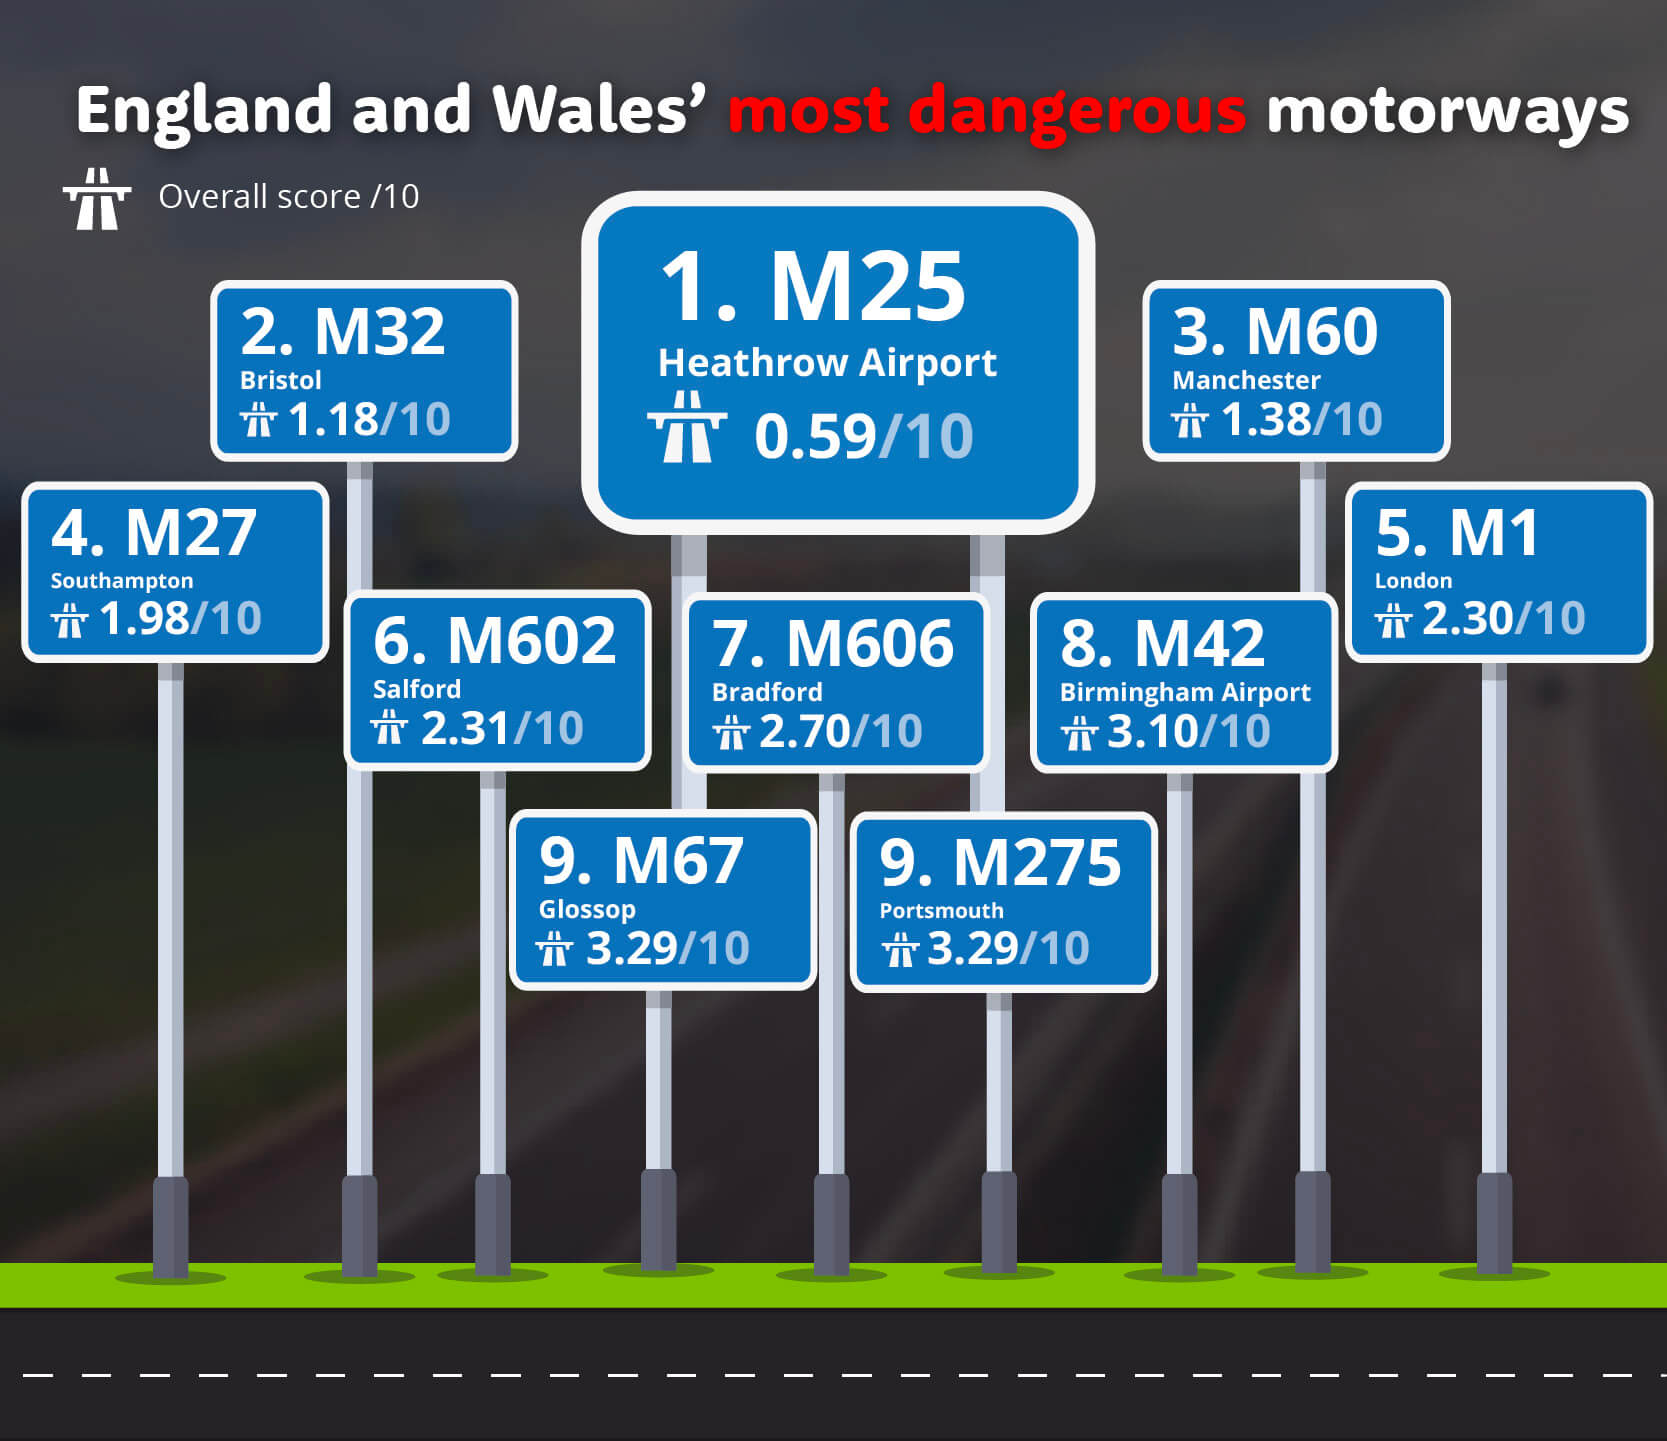
Here, the average number of collisions is significantly higher than the national average of one, and there are longer average delays and lower average speeds, which suggest a high traffic volume and reduced traffic flow.
Despite being more hazardous than most, the vast majority of drives on these motorways remain incident-free and are generally very safe. However, it is essential to drive vigilantly at all times and remain mindful of your surroundings.
| Rank | Motorway | Average vehicles per day | Collisions per km of motorway | Average speed (mph) | Average delay (seconds per vehicle per mile) | Overall score /10 |
|---|---|---|---|---|---|---|
| 1 | M25 | 135,838 | 2.2 | 50.3 | 19.7 | 0.59 |
| 2 | M32 | 76,713 | 2.2 | 45.8 | 24.9 | 1.18 |
| 3 | M60 | 114,984 | 1.3 | 52.1 | 17.5 | 1.38 |
| 4 | M27 | 98,618 | 1.9 | 56.7 | 12.1 | 1.98 |
| 5 | M1 | 104,690 | 1.2 | 56.3 | 12.6 | 2.30 |
| 6 | M602 | 65,566 | 2.2 | 53.2 | 16.2 | 2.31 |
| 7 | M606 | 61,366 | 1.5 | 53.1 | 16.3 | 2.70 |
| 8 | M42 | 91,163 | 0.8 | 53.5 | 16.0 | 3.10 |
| 9 | M67 | 39,718 | 0.9 | 44.7 | 29.1 | 3.29 |
| 9 | M275 | 66,318 | 1.3 | 56.3 | 12.5 | 3.29 |
Surrounding London, the M25 is the most hazardous motorway in the country, as it earned a safe motorway score of just 0.59 out of 10. It carries more traffic than any other motorway, with an average of 135,000 vehicles per day, which is more than double the national average of 65,000.
The M25 also sees more than double the national average of collisions per km (2.2 compared to one), meaning you are twice as likely to have a crash on this road than on an average motorway drive in England and Wales. Its myriad of quick-fire junctions, merging lanes, commuter traffic, and visitors unfamiliar with the road can all contribute to a higher collision rate.
Despite being one of the shortest motorways in the country, the M32 is one of the most dangerous. It is only 7.2 km long (almost 10 times shorter than the national average), but it is incredibly congested as it connects several key areas around Bristol and the South West, with an average of over 75,000 vehicles passing through it per day. Just like M25, there were 2.2 collisions per km of road, the joint highest in the country.
Just like the M25, the M60 motorway is the ring road of a major city, Manchester. The M60 has the second-highest average daily vehicle count (114,984) and is routinely brought to a standstill during peak hours as commuters try to enter and exit the city. However, there are far fewer collisions around Manchester than in London, 1.3 per km on the M60 compared to 2.2 per km on the M25.
One of the biggest hazards on motorways is collisions; not only do they cause damage to vehicles and injury to occupants, but they can also block the motorway and leave debris on the road, which can lead to further accidents.
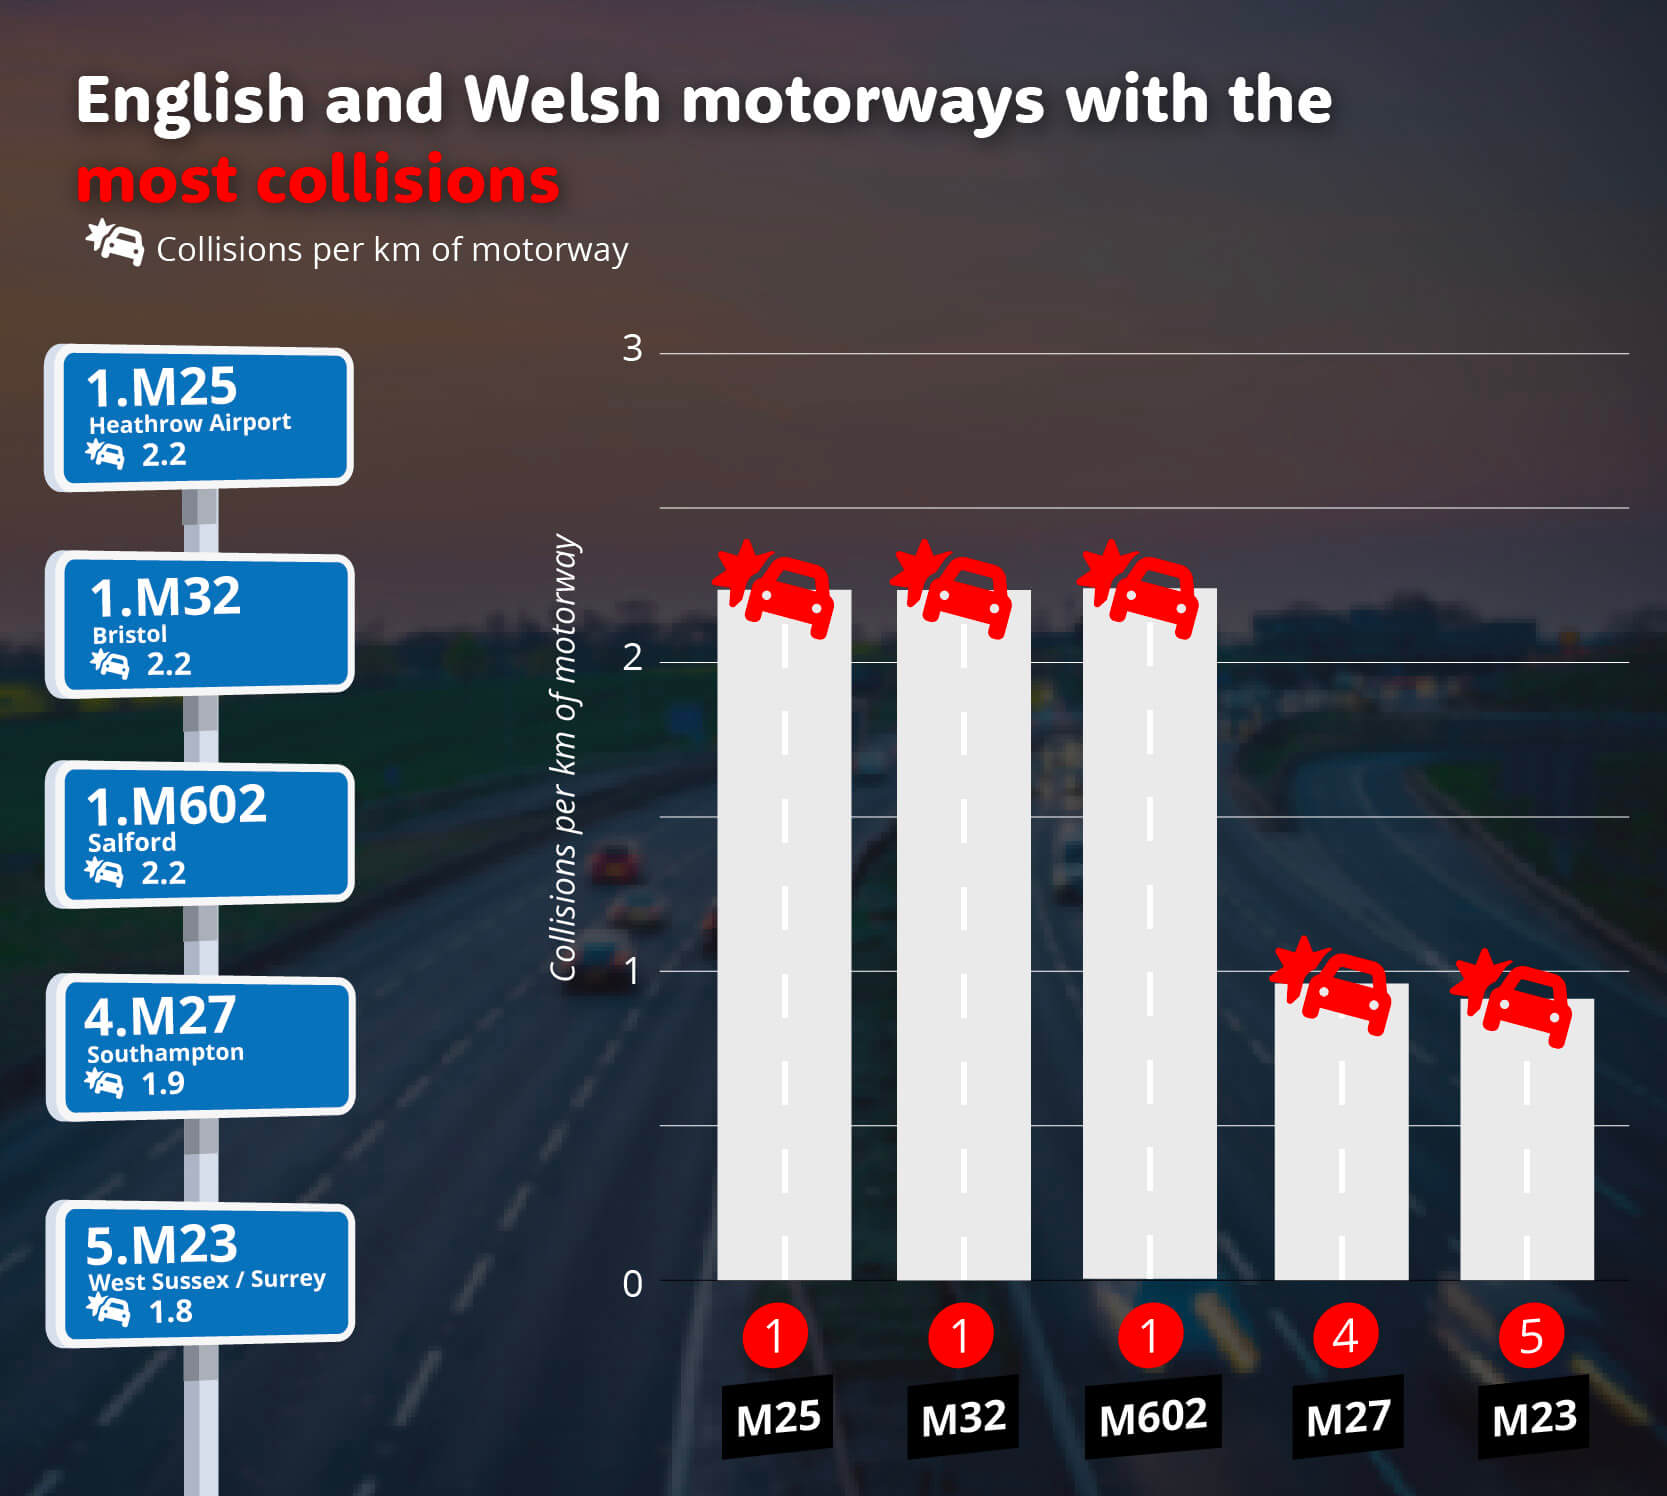
When studying the data on the motorways with the most collisions, it was found that across the nation, there is an average of one collision per km of road, and that three motorways had the most collisions at 2.2 per km, these were: the M5, the M32, and the M602.
| Rank | Motorway | Collisions per km of motorway |
|---|---|---|
| 1 | M25 | 2.2 |
| 1 | M32 | 2.2 |
| 1 | M602 | 2.2 |
| 4 | M27 | 1.9 |
| 5 | M23 | 1.8 |
| 6 | M65 | 1.6 |
| 6 | M61 | 1.6 |
| 8 | M11 | 1.5 |
| 8 | M606 | 1.5 |
| 10 | M60 | 1.3 |
The M25 has already been identified as one of the most hazardous motorways, and a major reason for this is its ranking in terms of the number of collisions that occur on it. Just like all of the highest-ranking motorways for the number of collisions, it is frequently used by commuters and visitors travelling into a major city.
Another of these is the M32, which serves as the main route into Bristol from lots of the surrounding countryside. Just like the M25, there is a high volume of vehicles, especially in relation to its size; 75,000 vehicles per day squeeze onto a section of road ten times shorter than the national average, which leads to high delays as well as many collisions.
Finally, the M602 is another tiny motorway (just 6.4 km), which transports vehicles from the M62 and M60 motorways through Salford toward Manchester City Centre. Despite it being a short and straight road, there are numerous junctions, turning lanes, and changing speed limits that can confuse drivers and lead to collisions.
At the other end of the scale are the motorways with the fewest collisions, ones where you are more likely to avoid an incident on an average journey.
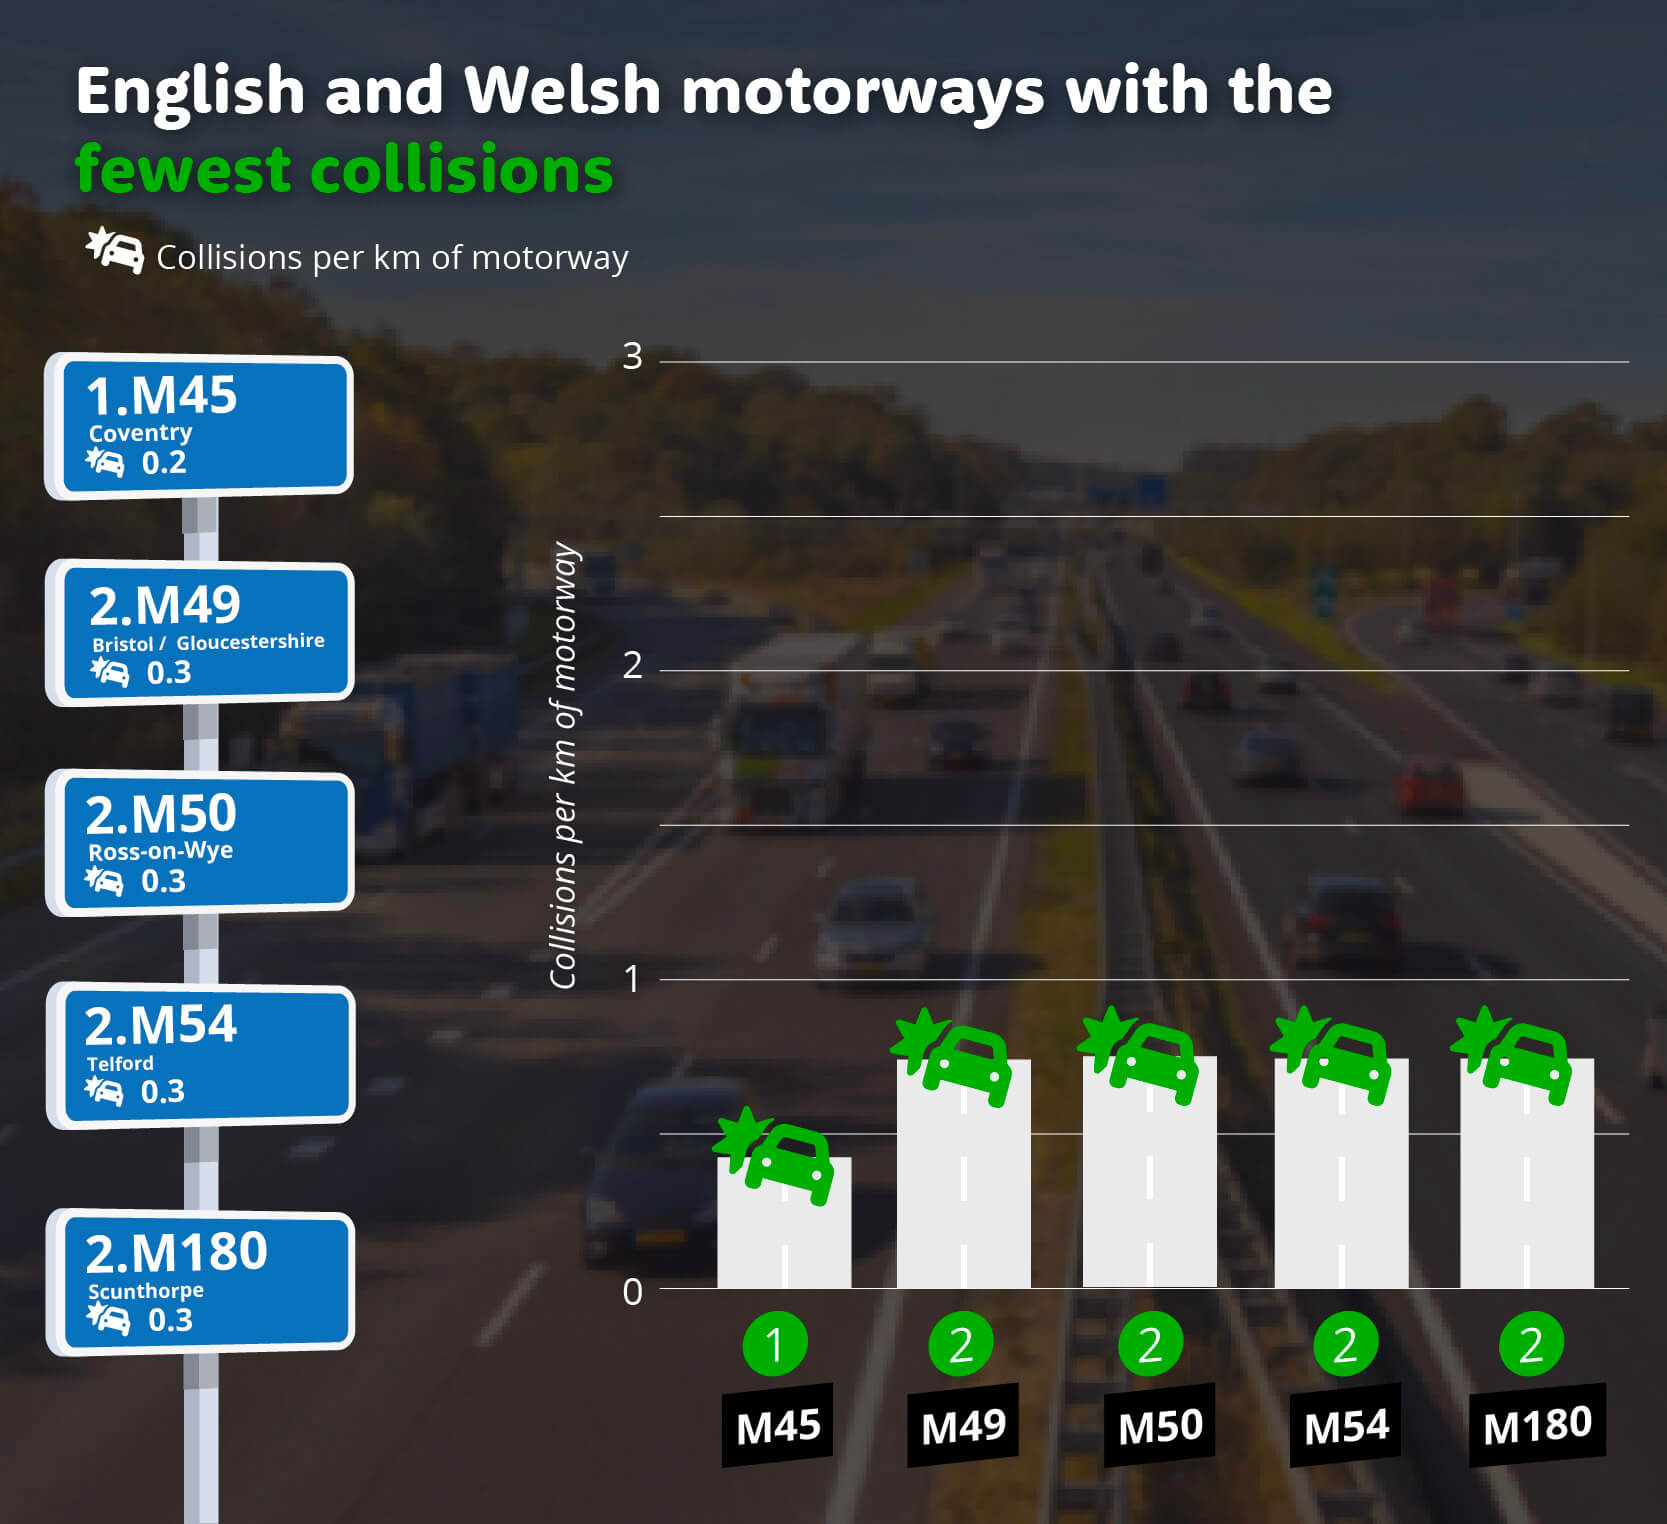
Twenty of the country’s motorways see fewer than a single collision per km of road, which is below the national average.
| Rank | Motorway | Collisions per km of motorway |
|---|---|---|
| 1 | M45 | 0.2 |
| 2 | M49 | 0.3 |
| 3 | M50 | 0.3 |
| 4 | M54 | 0.3 |
| 5 | M180 | 0.3 |
| 6 | M69 | 0.4 |
| 7 | M48 | 0.4 |
| 8 | M53 | 0.6 |
| 9 | M5 | 0.6 |
| 10 | M26 | 0.6 |
The M45 has the fewest collisions of any motorway; there are just 0.2 collisions per average km, meaning that you are more than ten times less likely to have a collision here than on the M25. A short motorway in the West Midlands, the M45 has one of the lowest traffic volumes of any motorway in the country, which helps result in fewer collisions.
Four separate motorways rank in second place, all of which have a collision rate of 0.3 per km, which means you are more than three times less likely to have a crash on these motorways than the national average.
One thing that all these motorways have in common is that they are all situated away from major population centres, and sometimes in completely rural areas. In contrast to the roads with the most collisions, these motorways usually have fewer commuters and visitors using them.
North of the border, in Scotland, motorway drivers face the same issues as in England. But some are greater in Scotland, such as adverse weather conditions with colder average temperatures and an increased risk of ice.
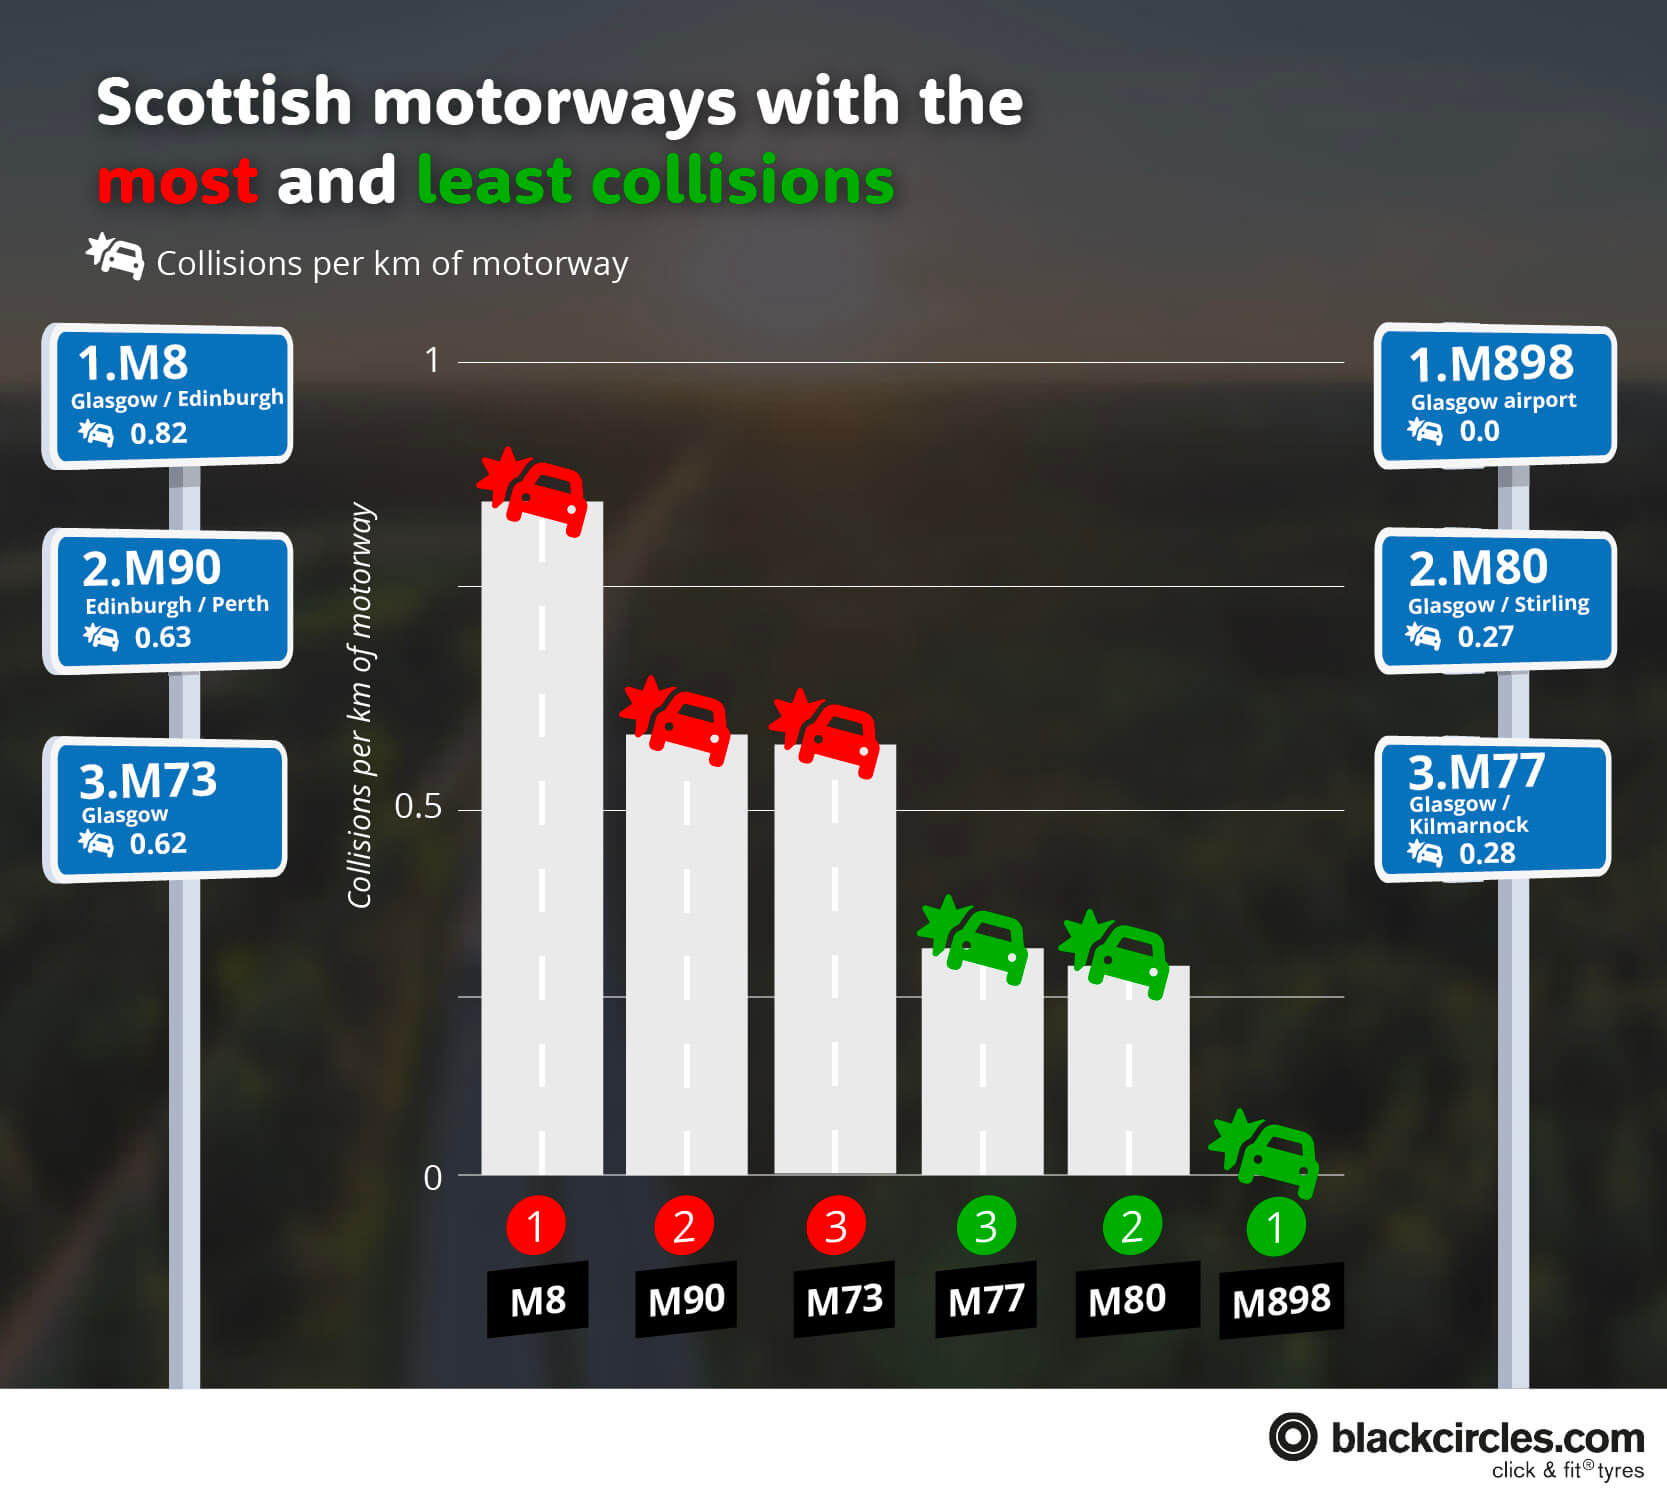
The data show that in Scotland, there are far fewer collisions recorded on motorways, at just 0.4 per km, compared to 1 per km in England. One reason for this might be the lack of traffic; the average daily number of vehicles on motorways in Scotland is 20,000 fewer than in England.
| Rank | Motorway | Collisions per km of motorway |
|---|---|---|
| 1 | M8 | 0.82 |
| 2 | M90 | 0.63 |
| 3 | M73 | 0.62 |
| 4 | M876 | 0.31 |
| 5 | M9 | 0.29 |
| 6 | M77 | 0.28 |
| 7 | M80 | 0.27 |
| 8 | M898 | 0.00 |
The M8 is the Scottish motorway with the highest number of collisions. By far the most collisions on Scottish motorways occur on the M8, where there are almost double the national average of 0.4 crashes per km, at 0.82.
The road connects Scotland’s two largest cities, Glasgow and Edinburgh, and as such, sees significantly more traffic than other roads, with almost 70,000 vehicles. The increased traffic, especially during weekday commutes, contributes to a higher number of collisions.
The M898 saw zero collisions, making it the safest motorway in Scotland. This is perhaps less of a surprise when you learn that the M898 is only a mile long, and doesn’t have any junctions save for its start and end. However, zero collisions is still very impressive given that almost 45,000 cars travel on the short stretch of road every day.
There are many ways to have a collision on a motorway, or in a car in general, and the vast majority are a result of human error on the part of a driver. In total, almost 3,000 motorway collisions were reported, with many more going unreported, as some causes contribute to a large majority of the total.
These are some of the most common causes of traffic collisions on motorways.
| Rank | Road safety factor | Reported motorway collisions |
|---|---|---|
| 1 | Ineffective observation by either the driver or rider or pedestrian | 727 |
| 2 | Driver or rider being aggressive or dangerous or reckless | 532 |
| 3 | Driver or rider travelling too fast for conditions (including loss of control or swerving) | 340 |
| 4 | Sudden braking or braking in a way unsuitable for conditions | 121 |
| 5 | Road surface was slippery due to weather | 119 |
| 6 | Distraction to driver or rider from inside or outside or on vehicle | 111 |
| 7 | Driver or rider too tired to drive or ride safely | 107 |
| 8 | Affected by alcohol | 101 |
| 9 | Driver or rider vision affected by adverse weather or dazzling sun | 95 |
| 10 | Driver or rider exceeding speed limit | 90 |
Driver error in the form of insufficient observation is the most common cause of collisions on motorways, and proves why being alert and watchful on the motorway is so important. Checking mirrors, blind spots, and the actions of other road users before attempting a manoeuvre are vital to avoid these collisions.
Aggressive and reckless driving are the second-largest cause of collisions on motorways, accounting for over 500. Aggressive driving can not only cause you to be involved in an accident, but it can also make other road users nervous, which can cause them to make a mistake and result in an accident.
The national speed limit of 70mph is enforced on most sections of motorway in the UK, but despite this, many drivers will exceed it – sometimes to extreme levels. Speeding in bad weather conditions can lead to aquaplaning, spinning, and crashes – as a result, over 300 motorway collisions were chalked up to speeding in adverse conditions.
James Harding, a tyre specialist with 15 years of experience at Blackcircles, shares tips and tricks on how to drive safely on a motorway to help avoid collisions, and keep you, your passengers, and other road users safe:
“To avoid collisions and injury on the motorway, there are several small precautions, habits, and changes that you can make to your driving.”
“Simple changes to your motorway driving could save your life, so don’t let bad habits creep into your driving style. Although you can’t control everything that goes on around you on the motorway, doing essential checks on your car before driving and keeping yourself as alert and safe as possible will all help.”
Blackcircles is an award-winning online tyre company that finds the best tyres at the best prices for your vehicle and needs. Not only that, but they also help find the best local garage to fit your tyres to ensure your car is ready to face the road.
Having poorly fitted, worn, or otherwise inadequate tyres is a major problem on the road and can lead to damage to your car. On top of this, accidents are more likely to occur in a car with poor tyres, resulting in more collisions.
Providing cars with the correct tyres helps drivers avoid danger. To raise awareness about the dangers on UK roads, we created this report, which shows which motorways are the safest and most hazardous for drivers.
Each motorway in England & Wales was analysed on the following factors:
Each motorway was given a normalised score from 0 to 10 for each factor, and an average of these was taken. Note that where the M6 and M6 Toll were listed separately, they were combined. A-roads operating under motorway regulations were excluded.
We also used https://www.gov.uk/government/statistical-data-sets/reported-road-accidents-vehicles-and-casualties-tables-for-great-britain to show the most common road safety factors that led to collisions on motorways in 2024.

We love to hear from our customers. Connect with us today and let’s start a conversation.