Join the conversation
We love to hear from our customers. Connect with us today and let’s start a conversation.
...searching
Car tyres are the only part of the vehicle that touches the road, yet our knowledge about them is surprisingly patchy. While many UK drivers feel confident about their tyre knowledge, the reality tells a different story.
From tread depth to run-flat technology and DOT numbers, drivers often overestimate their understanding, leaving blind spots that could have serious safety implications.
We first asked drivers how confident they felt… then we tested that confidence against real tyre safety questions. Our survey reveals where drivers are confident, where they are misinformed, and which regions and demographics are leading in terms of tyre knowledge.
Our findings show this confidence is often misplaced once the UK’s actual knowledge is tested.
| How confident do you feel in your car tyre knowledge? | |
|---|---|
| Very confident | 25% |
| Somewhat confident | 47% |
| Not very confident | 21% |
| Not at all confident | 6% |
Across the UK, 72% of drivers feel somewhat or very confident about their tyre knowledge, but later results reveal this confidence is frequently at odds with their actual understanding.
A quarter (25%) say they feel very confident, but this confidence proves shaky when compared against how few correctly answered basic tyre safety questions.
However, confidence varies by age and gender:
How confident do you feel in your car tyre knowledge?
| Female | Male | |
|---|---|---|
| Very confident | 20% | 31% |
| Somewhat confident | 41% | 55% |
| Not very confident | 29% | 12% |
| Not at all confident | 10% | 2% |
Men are more likely to describe themselves as very confident, while women tend to be more cautious in how they rate their knowledge. That difference in self-assessment becomes interesting later on, when we look at how both groups perform on the same questions.
How confident do you feel in your car tyre knowledge?
| 18 - 24 | 25 - 34 | 35 - 44 | 45 - 54 | 55 - 64 | 65+ | |
|---|---|---|---|---|---|---|
| Very confident | 28% | 41% | 33% | 19% | 19% | 13% |
| Somewhat confident | 42% | 44% | 48% | 50% | 45% | 50% |
| Not very confident | 24% | 12% | 14% | 23% | 28% | 31% |
| Not at all confident | 6% | 3% | 5% | 8% | 8% | 6% |
The generational trend is almost the opposite of what people might expect. Younger drivers are not the least confident.
This suggests that confidence may relate more to how recently someone learned to drive, but as later results show, even these ‘high-confidence’ groups frequently demonstrated gaps in fundamental tyre knowledge.
How confident do you feel in your car tyre knowledge?
| Belfast | Birmingham | Bristol | Cardiff | Edinburgh | Glasgow | Leeds | Liverpool | London | Manchester | Newcastle | Norwich | Nottingham | Sheffield | Southampton | |
|---|---|---|---|---|---|---|---|---|---|---|---|---|---|---|---|
| Very confident | 23% | 18% | 30% | 21% | 27% | 35% | 20% | 22% | 31% | 22% | 23% | 12% | 22% | 29% | 24% |
| Somewhat confident | 52% | 44% | 58% | 47% | 44% | 53% | 41% | 49% | 47% | 51% | 47% | 51% | 49% | 39% | 44% |
| Not very confident | 19% | 30% | 9% | 25% | 26% | 9% | 30% | 20% | 17% | 24% | 25% | 33% | 19% | 27% | 25% |
| Not at all confident | 6% | 8% | 4% | 8% | 3% | 3% | 9% | 9% | 5% | 4% | 5% | 4% | 10% | 5% | 7% |
Cities with the most drivers ‘very confident’ in their tyre knowledge:
Cities with the fewest drivers who are ‘very confident’ in their tyre knowledge:
This geographic spread indicates that local driving culture, road conditions, and vehicle ownership patterns can strongly influence both self-belief and uncertainty about tyres.
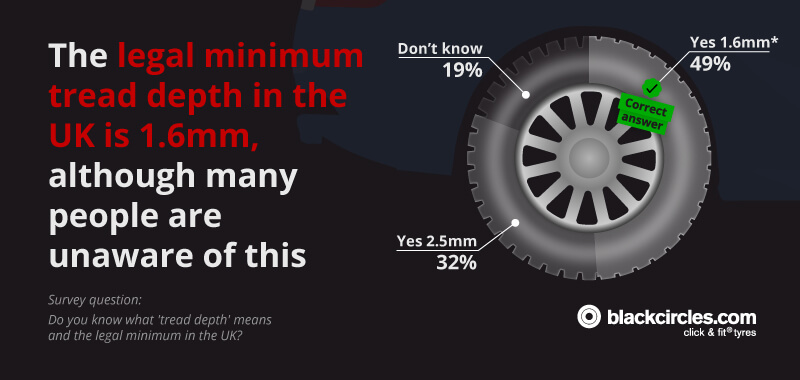
The legal minimum tread depth in the UK is 1.6mm, although many people are unaware of this. This is one of the first points where confidence and understanding start to drift apart.
| Do you know what 'tread depth' means and the legal minimum in the UK? | |
|---|---|
| Yes - 1.6mm [Correct answer] | 49% |
| Yes - 2.5mm | 32% |
| Don't know | 19% |
That means over half (51%) of UK drivers answered incorrectly or do not know the correct legal minimum, despite tread depth being one of the most crucial safety checks. This emphasises that for many drivers, confidence does not translate into understanding even the most basic legal requirement.
Do you know what 'tread depth' means and the legal minimum in the UK?
| Female | Male | |
|---|---|---|
| Yes - 1.6mm [Correct answer] | 45% | 53% |
| Yes - 2.5mm | 30% | 34% |
| Don't know | 24% | 13% |
Men are more confident, but not necessarily more accurate.
| Do you know what 'tread depth' means and the legal minimum in the UK? | 18 - 24 | 25 - 34 | 35 - 44 | 45 - 54 | 55 - 64 | 65+ |
|---|---|---|---|---|---|---|
| Yes - 1.6mm [Correct answer] | 41% | 55% | 52% | 51% | 45% | 43% |
| Yes - 2.5mm | 28% | 27% | 34% | 31% | 32% | 35% |
| Don't know | 31% | 18% | 14% | 19% | 23% | 22% |
Understanding of the minimum tread depth declines with age, revealing that confidence among older drivers is less aligned with actual knowledge:
Older drivers were also more likely to select the incorrect 2.5mm option.
| Do you know what 'tread depth' means and the legal minimum in the UK? | Belfast | Birmingham | Bristol | Cardiff | Edinburgh | Glasgow | Leeds | Liverpool | London | Manchester | Newcastle | Norwich | Nottingham | Sheffield | Southampton |
|---|---|---|---|---|---|---|---|---|---|---|---|---|---|---|---|
| Yes - 1.6mm [Correct answer] | 58% | 48% | 58% | 41% | 57% | 59% | 43% | 50% | 54% | 36% | 42% | 36% | 51% | 46% | 44% |
| Yes - 2.5mm | 26% | 31% | 23% | 39% | 31% | 32% | 34% | 31% | 30% | 31% | 45% | 46% | 31% | 27% | 34% |
| Don't know | 16% | 21% | 20% | 20% | 12% | 9% | 23% | 19% | 16% | 32% | 13% | 18% | 18% | 27% | 22% |
The cities most correct about tyre tread depth include:
These areas may benefit from harsher weather conditions and more variable road surfaces, which could make drivers more attuned to tyre wear.
The cities least correct about tyre tread depth include:
These are areas where high self-reported confidence clashes most sharply with real knowledge.
Manchester also had the highest rate of respondents who answered ‘don’t know’, at almost a third (32%). This suggests that, despite similar confidence levels to other cities, drivers there lack fundamental awareness of tyre safety basics.
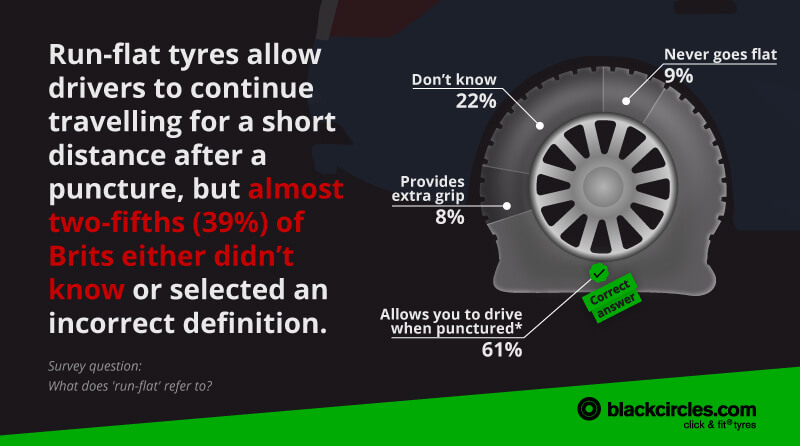
Run-flat tyres allow drivers to continue travelling for a short distance after a puncture, but almost two-fifths (39%) of Brits either didn’t know or selected an incorrect definition. This is another indication that self-confidence does not always align with understanding.
| What does 'run-flat' refer to? | |
|---|---|
| Never goes flat | 9% |
| Allows you to drive when punctured [Correct answer] | 61% |
| Provides extra grip | 8% |
| Don't know | 22% |
More than six in 10 (61%) respondents answered correctly, lower than the proportion who claimed confidence in their tyre knowledge
Over one in six (17%) chose the incorrect answer, thinking ‘run-flat tyres’ ‘never go flat’ or ‘provide extra grip’, showing that even confident drivers often hold mistaken beliefs about safety-critical features
Over a fifth (22%) admitted they did not know, a higher share than you might expect given the high confidence levels reported at the start of the survey
| What does 'run-flat' refer to? | Female | Male |
|---|---|---|
| Never goes flat | 11% | 6% |
| Allows you to drive when punctured [Correct answer] | 51% | 73% |
| Provides extra grip | 8% | 8% |
| Don't know | 30% | 13% |
Men showed a stronger understanding of run-flats. However, considering men claimed significantly higher confidence, their accuracy still falls short of what their self-belief suggests.
| What does 'run-flat' refer to? | 18 - 24 | 25 - 34 | 35 - 44 | 45 - 54 | 55 - 64 | 65+ |
|---|---|---|---|---|---|---|
| Never goes flat | 13% | 17% | 14% | 6% | 3% | 2% |
| Allows you to drive when punctured [Correct answer] | 46% | 56% | 56% | 66% | 63% | 68% |
| Provides extra grip | 17% | 12% | 13% | 4% | 3% | 2% |
| Don't know | 24% | 15% | 16% | 23% | 32% | 27% |
Correct understanding increases steadily with age, which contradicts earlier confidence patterns and reinforces that confidence is not a reliable indicator of knowledge:
Younger drivers were most likely to select a completely incorrect meaning:
What does 'run-flat' refer to?
| Belfast | Birmingham | Bristol | Cardiff | Edinburgh | Glasgow | Leeds | Liverpool | London | Manchester | Newcastle | Norwich | Nottingham | Sheffield | Southampton | |
|---|---|---|---|---|---|---|---|---|---|---|---|---|---|---|---|
| Never goes flat | 19% | 11% | 16% | 6% | 10% | 8% | 2% | 9% | 9% | 8% | 9% | 6% | 12% | 8% | 4% |
| Allows you to drive when punctured [Correct answer] | 48% | 59% | 64% | 56% | 69% | 67% | 65% | 64% | 64% | 47% | 55% | 60% | 67% | 66% | 61% |
| Provides extra grip | 13% | 5% | 3% | 5% | 4% | 8% | 8% | 4% | 8% | 20% | 8% | 6% | 3% | 2% | 9% |
| Don't know | 19% | 26% | 18% | 33% | 17% | 17% | 24% | 23% | 19% | 26% | 28% | 28% | 18% | 24% | 26% |
Edinburgh, Glasgow, and Nottingham had the strongest knowledge (69%, 67%, and 67% correct), which may be attributed to a combination of harsher weather, more varied driving conditions, and possibly higher engagement with vehicle maintenance
Cardiff, Newcastle, and Norwich saw the highest levels of uncertainty (28%+ 'don’t know'), again aligning with earlier indicators that a genuine understanding may not support confidence in these regions
The DOT code indicates tyre age and manufacturer. It’s a four-digit code marked on the sidewall noting the week and year of a tyre production, and plays a key role in identifying ageing tyres. Rubber hardens over time, so tyres have a five-year shelf life from the date of production, and up to 10 years for usage. Despite the usefulness of the DOT code, but it was the least understood term in the entire survey.
| What does the 'DOT number' on a tyre tell you? | |
|---|---|
| Tyre age and manufacturer [Correct answer] | 35% |
| Tyre type | 17% |
| Maximum speed rating | 10% |
| Don't know | 38% |
This means almost two-thirds (65%) of UK drivers do not understand what the DOT number tells them.
| What does the 'DOT number' on a tyre tell you? | Female | Male |
|---|---|---|
| Tyre age and manufacturer [Correct answer] | 32% | 38% |
| Tyre type | 16% | 17% |
| Maximum speed rating | 7% | 13% |
| Don't know | 44% | 32% |
Understanding of DOT numbers is low across both genders, demonstrating that low knowledge persists regardless of how confident drivers may feel:
Men were slightly more accurate but almost twice as likely to pick the incorrect ‘maximum speed rating’ option (7% compared with 14%).
| What does the 'DOT number' on a tyre tell you? | 18 - 24 | 25 - 34 | 35 - 44 | 45 - 54 | 55 - 64 | 65+ |
|---|---|---|---|---|---|---|
| Tyre age and manufacturer [Correct answer] | 38% | 50% | 39% | 34% | 25% | 26% |
| Tyre type | 17% | 19% | 24% | 16% | 12% | 11% |
| Maximum speed rating | 13% | 12% | 11% | 8% | 7% | 9% |
| Don't know | 32% | 18% | 26% | 42% | 55% | 54% |
Awareness drops sharply as age increases, reinforcing one of the strongest patterns in the report, that confidence does not reliably predict knowledge:
While drivers aged 25-34 show the highest understanding of DOT numbers (50% correct), accuracy falls to just 25-26% among those aged 55 and above.
This decline mirrors earlier findings on tread depth, where older drivers reported lower confidence and struggled with basic safety knowledge.
Unlike run-flat tyres, where understanding improved with age, DOT numbers stand out as an outlier, suggesting that tyre age is a knowledge gap that disproportionately affects older motorists, despite their longer driving experience.
| What does the 'DOT number' on a tyre tell you? | Belfast | Birmingham | Bristol | Cardiff | Edinburgh | Glasgow | Leeds | Liverpool | London | Manchester | Newcastle | Norwich | Nottingham | Sheffield | Southampton |
|---|---|---|---|---|---|---|---|---|---|---|---|---|---|---|---|
| Tyre age and manufacturer [Correct answer] | 42% | 30% | 44% | 26% | 35% | 47% | 29% | 37% | 41% | 26% | 33% | 24% | 30% | 37% | 32% |
| Tyre type | 26% | 14% | 15% | 17% | 22% | 13% | 12% | 17% | 19% | 15% | 22% | 22% | 14% | 10% | 15% |
| Maximum speed rating | 6% | 7% | 10% | 11% | 12% | 11% | 18% | 7% | 9% | 16% | 11% | 6% | 10% | 2% | 6% |
| Don't know | 26% | 50% | 31% | 46% | 31% | 29% | 41% | 39% | 31% | 42% | 34% | 48% | 46% | 51% | 47% |
Cities with the strongest understanding of DOT numbers:
Cities with the strongest understanding of DOT numbers, including Glasgow (47%), Bristol (44%), and Belfast (42%), broadly align with the rest of the survey findings.
These cities also performed relatively well in terms of tread depth and run-flat knowledge, suggesting a more consistent awareness of tyre safety overall. This may reflect factors such as harsher weather conditions, varied road conditions, or increased engagement with vehicle maintenance.
Cities with limited knowledge:
In contrast, Norwich, Birmingham, and Sheffield emerge as clear outliers. In these cities, around half of drivers admitted they didn’t know what the DOT number indicates, reinforcing a recurring theme across the report, that confidence in tyre knowledge in these areas does not translate into understanding of safety-critical details.
The tyre shoulder is the outer edge of the tread, but less than one in four (24%) drivers identified this correctly, reflecting again that high confidence levels are not always matched by real technical understanding.
| Which of these terms refers to the outer edge of the tyre tread? | |
|---|---|
| Sidewall | 34% |
| Bead | 12% |
| Shoulder [Correct answer] | 24% |
| Camber | 7% |
| Don't know | 23% |
Only 24% of drivers correctly identified the tyre shoulder, while over a third (34%) confused it with the sidewall, and a further 23% admitted they didn’t know. This mirrors our earlier findings on tread depth and DOT numbers, where basic terminology proved far less understood than drivers’ confidence levels would suggest.
Unlike run-flat tyres, where a clear majority answered correctly, tyre anatomy stands out as a particular weak point.
This suggests that while drivers may feel confident performing visible checks, they often lack the technical expertise necessary to identify early warning signs of wear or alignment issues.
| Which of these terms refers to the outer edge of the tyre tread? | Female | Male |
|---|---|---|
| Sidewall | 34% | 35% |
| Bead | 13% | 11% |
| Shoulder [Correct answer] | 18% | 30% |
| Camber | 7% | 7% |
| Don't know | 28% | 17% |
Men showed greater accuracy (30% compared with 18% among women), a pattern that follows earlier findings where men reported higher confidence. However, this gap is less pronounced than confidence levels alone would suggest.
Notably, women were less likely to choose the incorrect ‘sidewall’ response than men (34% compared with 35%), indicating greater uncertainty rather than misplaced confidence.
This reflects a broader theme that men are more likely to answer with confidence, even when incorrect, while women are more willing to acknowledge knowledge gaps.
| Which of these terms refers to the outer edge of the tyre tread? | 18 - 24 | 25 - 34 | 35 - 44 | 45 - 54 | 55 - 64 | 65+ |
|---|---|---|---|---|---|---|
| Sidewall | 27% | 27% | 27% | 36% | 43% | 41% |
| Bead | 21% | 17% | 22% | 10% | 6% | 3% |
| Shoulder [Correct answer] | 18% | 30% | 23% | 22% | 17% | 27% |
| Camber | 7% | 11% | 8% | 5% | 3% | 6% |
| Don't know | 27% | 15% | 20% | 27% | 31% | 22% |
Accuracy varied sharply across age groups, peaking with those aged 25 to 34:
The youngest drivers, aged 18 to 24, along with drivers between 55 and 64 were the least likely to identify the shoulder correctly, and were more likely to confuse it with the sidewall.
Even the best-performing age group still falls far short of matching the confidence levels they reported earlier.
| Which of these terms refers to the outer edge of the tyre tread? | Belfast | Birmingham | Bristol | Cardiff | Edinburgh | Glasgow | Leeds | Liverpool | London | Manchester | Newcastle | Norwich | Nottingham | Sheffield | Southampton |
|---|---|---|---|---|---|---|---|---|---|---|---|---|---|---|---|
| Sidewall | 45% | 40% | 28% | 39% | 36% | 40% | 41% | 37% | 30% | 26% | 39% | 39% | 36% | 46% | 33% |
| Bead | 16% | 13% | 20% | 8% | 17% | 8% | 8% | 11% | 12% | 16% | 14% | 10% | 12% | 12% | 9% |
| Shoulder [Correct answer] | 13% | 12% | 30% | 26% | 21% | 25% | 15% | 25% | 33% | 17% | 13% | 21% | 18% | 15% | 26% |
| Camber | 6% | 7% | 5% | 3% | 9% | 9% | 8% | 4% | 6% | 12% | 3% | 9% | 10% | 8% | 4% |
| Don't know | 19% | 28% | 18% | 24% | 17% | 17% | 27% | 23% | 20% | 29% | 31% | 21% | 23% | 19% | 27% |
Cities with the strongest understanding:
These cities generally align with cities that performed well across multiple tyre knowledge areas, including tread depth and DOT awareness. This consistency suggests broader familiarity with tyre maintenance rather than isolated knowledge.
Those with the lowest:
Birmingham, Newcastle, and Belfast stand out as notable outliers. Despite comparable confidence levels to other cities, fewer than one in seven drivers in these locations correctly identified the tyre shoulder. This reinforces the pattern that confidence alone is not a reliable indicator of real-world tyre knowledge.
The results reveal that drivers trust their knowledge more than the data supports, creating a consistent pattern of overconfidence throughout the survey.
High confidence paired with low accuracy suggests that many motorists may believe they are maintaining their tyres properly, when in reality, they are missing key safety indicators such as tread depth and tyre age.
Misunderstanding tyre terminology can affect:
Tyres are the only point of contact between a vehicle and the road. A clear understanding of safety basics, such as tread depth, tyre age, and puncture behaviour, is essential for informed decisions.
Ray Kavanagh, Chief Executive Officer at Blackcircles, shares his insights on how most of the misunderstood terms relate directly to safety-critical checks:
Blackcircles is an award-winning online tyre company that finds the best tyres at the best prices for your vehicle and needs. Not only that, but they also help find the best local garage to fit your tyres to ensure your car is ready to face the road.
Having poorly fitted, worn, or otherwise inadequate tyres is a major problem on the road and can lead to damage to your car. On top of this, accidents are more likely to occur in a car with poor tyres, resulting in more collisions.
Providing cars with the correct tyres helps drivers avoid danger. To raise awareness about the dangers on UK roads, we created this survey of a nationally representative sample of 2,000 UK drivers. Respondents were surveyed across gender, age and major UK cities. For demographic comparisons, transgender responses were not analysed due to a base of two respondents.

We love to hear from our customers. Connect with us today and let’s start a conversation.