Join the conversation
We love to hear from our customers. Connect with us today and let’s start a conversation.
...searching
Potholes are a persistent problem on British roads. Between 2021 and 2025, more than 1.2 million potholes were reported across the UK, with some councils recording thousands of defects per 100km of road.
Pothole-related callouts for issues such as damaged car tyres, wheels, and suspension have increased by 18% across the UK, highlighting the growing pressure on drivers and local authorities alike1.
Some areas of the country have more potholes than others, due to factors such as weather, traffic volume, and highway maintenance. But where in the country are you most likely to see a pothole, and where are councils responding most effectively?
Between 2021 and 2025, 1.22 million potholes were reported across the UK, with some councils recording significantly higher volumes than others. Overall, pothole numbers have increased by 5.5% in the past half-decade across all council areas studied.
When adjusted for road length, the data reveals a clearer picture of where drivers are most likely to encounter damaged road surfaces. By analysing total pothole reports per 100km of road, we can see which local authorities are under the greatest pressure.
| Rank | Council | Total road length (km) | 2021 | 2022 | 2023 | 2024 | 2025 | 2021-2025 total | 2021-2025 total (per 100km) |
|---|---|---|---|---|---|---|---|---|---|
| 1 | Aberdeen | 1,079 | 16,987 | 16,852 | 23,014 | 29,041 | 26,277 | 112,171 | 10,396 |
| 2 | Cardiff | 1,121 | 13,439 | 13,022 | 17,490 | 15,761 | 14,399 | 74,111 | 6,611 |
| 3 | Nottingham | 803 | 6,729 | 5,446 | 6,862 | 17,133 | 16,516 | 52,686 | 6,561 |
| 4 | Edinburgh | 1,611 | 28,707 | 16,374 | 23,935 | 21,429 | 13,429 | 103,874 | 6,448 |
| 5 | Barking and Dagenham | 346 | 5,158 | 5,038 | 3,954 | 3,587 | 3,792 | 21,529 | 6,222 |
| 6 | Glasgow | 1,938 | 20,119 | 20,843 | 26,231 | 28,661 | 21,798 | 117,652 | 6,071 |
| 7 | Wolverhampton | 746 | 6,989 | 5,598 | 8,150 | 8,346 | 3,792 | 32,875 | 4,407 |
| 8 | Blackpool | 448 | 4,337 | 3,961 | 3,225 | 4,044 | 2,765 | 18,332 | 4,092 |
| 9 | Liverpool | 1,434 | 11,263 | 11,225 | 14,754 | 13,247 | 7,942 | 58,431 | 4,075 |
| 10 | Islington | 237 | 1,989 | 1,797 | 1,838 | 1,519 | 1,896 | 9,039 | 3,814 |
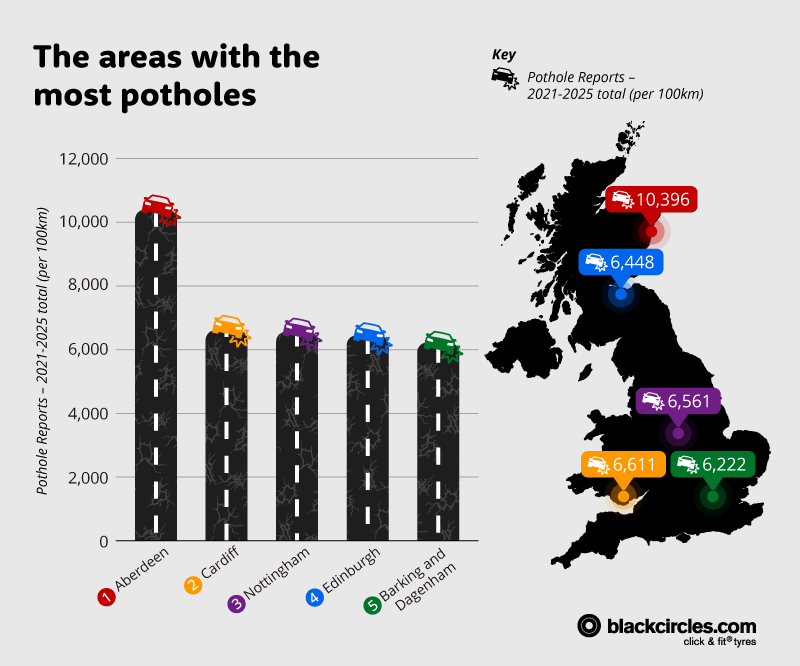
Aberdeen records the highest rate of pothole reports in the study, with 10,396 defects per 100km between 2021 and 2025.
While the city ranks first overall, reported defects fell between 2024 and 2025, indicating recent improvement following council investment in repair works2.
Pothole formation is commonly linked to freeze–thaw cycles and surface fatigue caused by sustained traffic load, factors that can accelerate deterioration when road surfaces are already weakened3. The average winter temperature in Aberdeen is 4.8℃, much lower than the UK average of 6.5℃, which increases the risk of freeze-thaw damage4.
Cardiff ranks second overall, recording 6,611 potholes per 100km – placing the Welsh capital firmly among the UK’s pothole hotspots.
While annual figures fluctuated over the study period, Cardiff’s five-year rate remains significantly above many of the authorities analysed.
Road surface deterioration is typically influenced by a combination of factors, including traffic density, the presence of heavy vehicles, and the age of the underlying infrastructure. In larger urban areas such as Cardiff, even relatively small surface weaknesses can develop into reportable defects over time.
Nottingham had the third-highest amount of pothole reports, with 6,561 reported per 100km. Throughout the five-year study period, Nottingham council reported over 52,000 potholes.
The pothole issue has increased in Nottingham, with 2025 reports (16,516) more than double those in 2021 (6,729).
A spokesperson for Nottingham’s council stated that the reasons for the rapid rise were icier winter conditions, increased rainfall, and increased traffic5.
While some councils are facing tens of thousands of pothole reports, others record significantly lower volumes when adjusted for the size of their road network.
Analysing reports per 100km of road highlights the areas where motorists are statistically far less likely to encounter damaged surfaces.
| Rank | Council | Total road length (km) | 2021 | 2022 | 2023 | 2024 | 2025 | 2021-2025 total | 2021-2025 total (per 100km) |
|---|---|---|---|---|---|---|---|---|---|
| 1 | Portsmouth | 457 | 170 | 130 | 392 | 121 | 208 | 1,021 | 223 |
| 2 | Enfield | 636 | 474 | 394 | 1,121 | 886 | 627 | 3,502 | 551 |
| 3 | Westminster | 337 | 472 | 480 | 497 | 422 | 589 | 2,460 | 730 |
| 4 | Lambeth | 383 | 315 | 462 | 700 | 722 | 599 | 2,798 | 731 |
| 5 | Reading | 399 | 835 | 622 | 534 | 473 | 525 | 2,989 | 749 |
| 6 | Newport | 774 | 774 | 508 | 1,706 | 1,640 | 1,289 | 5,917 | 764 |
| 7 | Hounslow | 500 | 883 | 647 | 1,345 | 1,379 | 1,156 | 5,410 | 1,082 |
| 8 | Telford and Wrekin | 1,101 | 3,213 | 2,367 | 3,066 | 2,925 | 2,004 | 13,575 | 1,233 |
| 9 | Coventry | 905 | 2,738 | 2,230 | 2,730 | 2,467 | 2,164 | 12,329 | 1,362 |
| 10 | Milton Keynes | 1,372 | 3,123 | 4,517 | 6,022 | 2,365 | 3,010 | 19,037 | 1,388 |
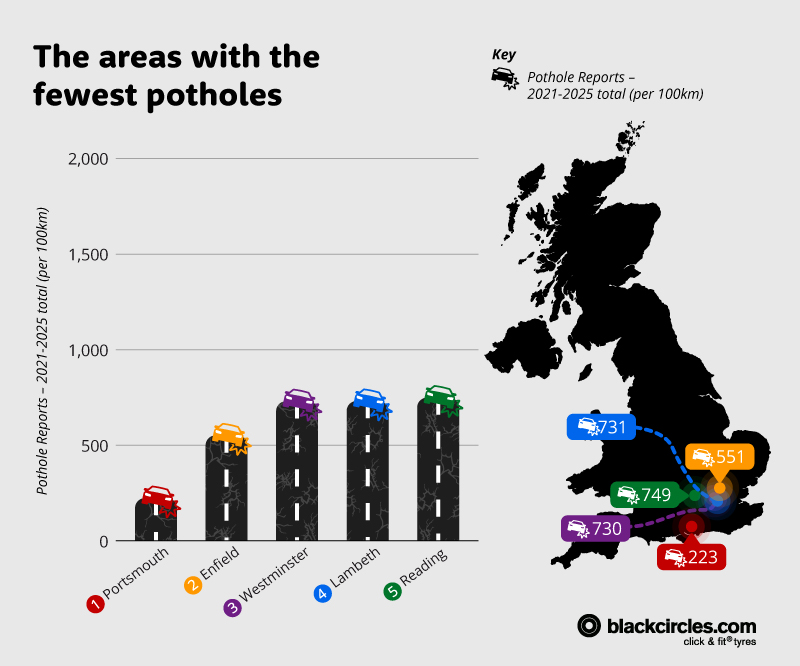
Portsmouth records the lowest rate of reported potholes in the dataset, with just 223 reports per 100km of road between 2021 and 2025 – almost 50 times fewer than Aberdeen.
With a relatively compact road network and consistently low annual figures, the city stands out as one of the UK’s strongest performers for overall pothole reports. For drivers, that can mean smoother daily journeys and a reduced likelihood of tyre damage, wheel alignment issues, or unexpected repair bills.
With just 551 potholes per 100km, Enfield has the second fewest pothole reports of any area studied.
In January 2025, the government allocated extra funds to tackle potholes in Enfield, which perhaps helps account for a large reduction (29%) between 2024 and 20256.
Westminster records the third-lowest pothole rate in the study, with 730 reported per 100km of road. While this is more than three times the rate seen in Portsmouth, it remains significantly lower than most other councils analysed.
The city of Westminster, in central London, is home to the government, the royal family, and some of the country's biggest tourist attractions. Perhaps this prestige and footfall are a motivation to keep the roads in better condition and prevent potholes from forming. Moreover, there are fewer permanent residents in the area, and visitors are less likely to report potholes.
Reporting potholes is one side of the story; repairing them is another. Of the councils studied, a collective 1.2 million potholes were repaired in the past five years, which is around 2,400 per 100km of roads.
For drivers, high repair figures can be reassuring, but they also highlight just how frequent pothole formation has become. In some areas, where more potholes have been repaired than reported, this suggests that councils have only recently ramped up efforts to combat potholes.
| Rank | Council | Total road length (km) | 2021 | 2022 | 2023 | 2024 | 2025 | 2021-2025 total | 2021-2025 total (per 100km) |
|---|---|---|---|---|---|---|---|---|---|
| 1 | Redbridge | 537 | 7,597 | 8,187 | 12,897 | 21,098 | 13,631 | 63,410 | 11,808 |
| 2 | Middlesbrough | 579 | 23,560 | 6,868 | 5,303 | 5,268 | 6,155 | 47,154 | 8,144 |
| 3 | Nottingham | 803 | 6,729 | 5,446 | 6,862 | 17,133 | 16,516 | 52,686 | 6,561 |
| 4 | Edinburgh | 1,611 | 28,920 | 16,410 | 23,520 | 21,892 | 13,409 | 104,151 | 6,465 |
| 5 | Cardiff | 1,121 | 12,404 | 11,909 | 17,229 | 13,891 | 11,591 | 67,024 | 5,979 |
| 6 | Richmond upon Thames | 413 | 4,328 | 3,813 | 5,206 | 3,269 | 3,019 | 19,635 | 4,754 |
| 7 | Wolverhampton | 746 | 6,872 | 5,409 | 6,879 | 7,886 | 2,989 | 30,035 | 4,026 |
| 8 | Islington | 237 | 1,989 | 1,821 | 1,698 | 1,424 | 1,896 | 8,828 | 3,725 |
| 9 | Blackpool | 448 | 3,857 | 3,175 | 2,628 | 3,204 | 2,207 | 15,071 | 3,364 |
| 10 | Southampton | 593 | 4,002 | 3,972 | 3,627 | 4,162 | 3,113 | 18,876 | 3,183 |
Redbridge records the highest repair rate in the UK, completing 11,808 pothole repairs per 100km between 2021 and 2025.
Over the five years, the council carried out more than 63,000 repairs, placing it significantly ahead of other authorities, adjusted for network size.
Notably, Redbridge repaired more defects per 100km than were reported over the same period, suggesting the council addressed historic defects or undertook proactive maintenance beyond newly logged reports.
The second-highest repair rate was recorded in Middlesbrough, a northeastern town, which repaired 8,144 potholes per 100km in the past five years.
In 2021, Middlesbrough repaired over 23,000 potholes, and in subsequent years, no more than 7,000 have been repaired per year, suggesting that the big effort in 2021 helped contain the problem.
Consistently, Middlesbrough council has repaired more potholes than have been reported over the five years, which could indicate an existing backlog of unfilled potholes.
Nottingham ranks third for both the number of repairs, with 6,561 per 100km. In 2024 and 2025, the total number of repairs rose dramatically from previous years, suggesting an increased focus on pothole repairs.
The city also ranks among the highest for reported defects, with repair volumes closely aligned to report totals over the five-year period. This suggests continued maintenance efforts to keep pace with incoming reports.
Overall, councils are spending a lot of money on repairing roads; in total, over £400 million was spent by the councils in the study over the past five years, averaging just under £700,000 per 100 km of road.
Strategic spending can play a critical role in preventing further deterioration. Targeted resurfacing programmes and rapid-response repairs help limit the lifespan of potholes before they expand and cause more severe vehicle damage7.
| Rank | Council | Total road length (km) | 2021-2025 total | 2021-2025 total (per 100km) |
|---|---|---|---|---|
| 1 | Stoke-on-Trent | 890 | £71,026,000 | £7,980,449 |
| 2 | Luton | 468 | £27,325,218 | £5,838,722 |
| 3 | Bexley | 551 | £22,936,000 | £4,162,613 |
| 4 | Kingston upon Thames | 344 | £14,026,100 | £4,077,355 |
| 5 | Croydon | 775 | £25,539,203 | £3,295,381 |
| 6 | Bromley | 916 | £19,579,000 | £2,137,445 |
| 7 | Enfield | 636 | £12,546,616 | £1,972,738 |
| 8 | Cardiff | 1,121 | £20,152,571 | £1,797,732 |
| 9 | Brighton and Hove | 620 | £8,548,655 | £1,378,815 |
| 10 | Newport | 774 | £8,474,026 | £1,094,835 |
Stoke-on-Trent records the highest proportional spending on road maintenance, including pothole repairs, over the past five years, indicating a major financial commitment to this work.
In total, they spent over £2 million per 100km more than the second-ranking area.
Luton ranks second, with £5.84 million per 100km spent on road surface and defect-related repairs.
Over the five-year period, more than £27 million was allocated to maintenance activity. When adjusted for network size, this places Luton among the most heavily investing councils in the dataset.
Bexley records spending of £4.16 million per 100km between 2021 and 2025.
The London borough allocated nearly £23 million to road maintenance during the study period, reflecting sustained investment relative to its network size.
To discover the sentiment around the pothole problem among members of the British public, a survey was conducted of residents across the country to establish the pothole issues they experience day to day.
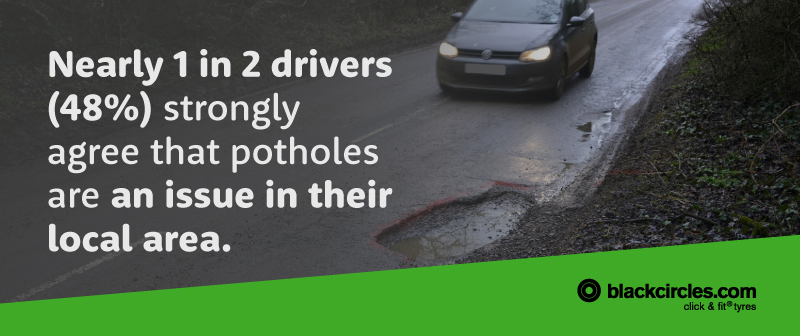
Do you agree that potholes are an issue in your local area?
| Yes, strongly agree | 48% |
| Yes, somewhat agree | 39% |
| Neutral | 7% |
| No, somewhat disagree | 4% |
| No, strongly disagree | 1% |
| Not sure | 1% |
Public frustration is clear: 87% of drivers say potholes are a problem in their area, and only 1% report no issues with potholes.
Further findings from the survey showed that:
On average, how quickly do you feel potholes are typically resolved in your local area?
| Within a week | 14% |
| 1-2 weeks | 13% |
| 3-4 weeks | 10% |
| 1-3 months | 13% |
| 4-6 months | 9% |
| Over 6 months | 9% |
| They are rarely or never fixed | 19% |
| No idea | 12% |
| There are no potholes in my local area | 1% |
Almost 20% of people believe potholes are not fixed at all, suggesting the highest single portion of those surveyed feel pothole issues are not being addressed at all. However, 14% of people surveyed feel they get fixed within a week, suggesting that swift action is often possible, provided the resources are available.
Further findings from the survey showed that:
If you have ever experienced damage to your vehicle due to potholes, how much did it cost you on average to repair your vehicle?
| £0 - £100 | 11% |
| £101 - £200 | 23% |
| £201 - £300 | 12% |
| £301 - £400 | 8% |
| £500 + (please specify) | 1% |
| I haven't experienced any damage to my vehicle as a result of potholes | 45% |
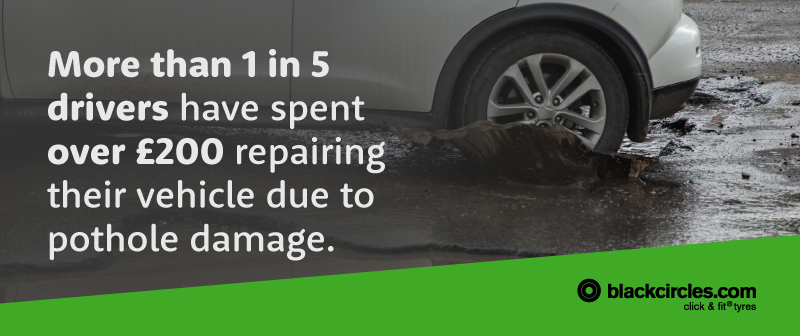
Over half (55%) of Brits have experienced damage to their vehicles due to potholes, and among those who have, the most common cost bracket was £101-£200 (23%). A further 21% of respondents report paying more than £201 for repairs caused by potholes.
Further findings from the survey showed that:
“The scale of pothole reports in parts of the UK highlights how persistent the problem remains, and our findings show that drivers are feeling the impact, both financially and in terms of road safety.
Even relatively small potholes can cause issues if struck at speed. The most common problems we see are tyre sidewall bulges, punctures, cracked alloy wheels and suspension misalignment. In some cases, the damage isn’t immediately visible but develops later as vibration, uneven tyre wear or steering pull.
If a driver hits a pothole, the safest approach is to maintain control of the vehicle, avoid sudden swerving, and check the tyres as soon as it’s safe to do so. Look for cuts, bulges, or loss of pressure, and pay attention to any changes in handling. Addressing problems early can prevent more serious (and possibly more expensive) repairs further down the line.
Reporting potholes can help councils prioritise and speed up road repairs, reducing the risk of damage to other motorists. Most local councils have a dedicated page on their website to report road faults, but as they are not uniform across the country, some are easier to find than others.”
Blackcircles is the UK’s leading online tyre retailer, helping drivers compare and buy tyres online before booking fitting at a time and location that suits them from a network of over 2,000 garages nationwide.
In addition to tyre fitting, Blackcircles offers MOTs and vehicle servicing to help keep cars safe, roadworthy, and compliant with UK regulations. Road conditions play a major role in vehicle maintenance, with potholes capable of damaging tyres, wheels, and suspension – issues that can lead to costly repairs or MOT failures.
To highlight the impact potholes can have on drivers and their vehicles, we analysed the following data to produce this report.
Data was obtained through Freedom of Information (FOI) requests submitted to the local authorities of each London borough, as well as to those of the 50 biggest cities and towns outside London. Data was requested for the most recent five complete calendar years (2021-25), but in some cases was sent as financial years.
Note: Because councils record and categorise pothole and highways maintenance data differently, figures have been standardised using the closest comparable data available.
Not all councils contacted responded to the request.
Each authority was asked to provide, for the most recent five complete years:
Potholes / Carriageway Defects
Repairs
Expenditure
There is no national standard definition of a pothole. Authorities differ in how they record:
Where councils record “defects” rather than “potholes”, defect data was used as the closest equivalent.
All figures reflect how each authority logs data in its own systems.
Most councils do not isolate spending on potholes alone. Therefore:
Expenditure therefore represents the total council investment in carriageway surface and defect-related maintenance, including potholes.
To maintain comparability, authorities were excluded where:
To allow fair comparison between authorities of different sizes, figures were normalised against road network length, sourced from https://www.gov.uk/government/statistical-data-sets/road-length-statistics-rdl
We also surveyed 2,000 drivers in the UK, asking the following questions:
Responses were then split to yield results by gender, age group, and location.

We love to hear from our customers. Connect with us today and let’s start a conversation.