Join the conversation
We love to hear from our customers. Connect with us today and let’s start a conversation.
...searching
Faulty car tyres are a serious road safety hazard that can cause vehicle problems such as longer braking distances, loss of control, and even catastrophic blowouts. Whether the problem stems from wear and tear, manufacturing defects, poor maintenance, or incorrect tyre fitting, the consequences can be life-threatening for drivers, passengers, and other road users.
Driving with faulty tyres can result in fines of up to £2,500 and three penalty points per tyre. More importantly, unsafe tyres significantly increase the risk of accidents, particularly in poor weather or high speeds.
But where in the UK is the issue the worst, where people are having the most accidents and failing MOTs due to their tyres?
We’ve analysed data from the Department for Transport to determine which parts of the UK have had the most collisions caused by illegal, defective, and under-inflated tyres between 2019 and 2023, calculating this per 100,000 people in each area.
| Collisions due to illegal, defective, and under-inflated tyres (2019 - 2023) | |||||
| Rank | Local authority | Region | Population | Total | Per 100,000 people |
| 1 | Wiltshire | South West | 517,979 | 46 | 8.88 |
| 2 | Cornwall | South West | 578,324 | 44 | 7.61 |
| 3 | Herefordshire, County of | West Midlands | 189,890 | 14 | 7.37 |
| 4 | Dumfries and Galloway | Scotland | 145,670 | 10 | 6.86 |
| 5 | Devon | South West | 833,408 | 56 | 6.72 |
| 6 | Central Bedfordshire | East of England | 308,302 | 20 | 6.49 |
| 7 | Thurrock | East of England | 178,201 | 11 | 6.17 |
| 8 | Newport | Wales | 163,628 | 10 | 6.11 |
| 9 | Perth and Kinross | Scotland | 152,560 | 9 | 5.90 |
| 10 | North Yorkshire | Yorkshire and The Humber | 627,629 | 36 | 5.74 |
| 11 | Kent | South East | 1,610,251 | 89 | 5.53 |
| 12 | Rhondda Cynon Taf | Wales | 241,178 | 13 | 5.39 |
| 13 | Conwy | Wales | 114,410 | 6 | 5.24 |
| 14 | Powys | Wales | 134,439 | 7 | 5.21 |
| 15 | Caerphilly | Wales | 176,437 | 9 | 5.10 |
Smaller and more rural areas dominate the top end of the list, especially those in the South West.
Rural areas, especially in the South West and parts of Wales, experience more tyre-related collisions per capita.
Cities and other urban areas have much lower rates, which may be due to people travelling shorter distances, having better access to maintenance, or relying less on cars.

We’ve also looked at the areas with the most significant increase in collisions due to illegal, defective, and under-inflated tyres between 2019 and 2023. However, the actual number of incidents remained low across most regions.
| Collisions due to illegal, defective, and under-inflated tyres | ||||||||
| Rank | Local authority | Region | 2019 | 2020 | 2021 | 2022 | 2023 | Change (2019-2023) |
| 1 | Bristol, City of | South West | 1 | 0 | 2 | 3 | 5 | 400% |
| 2 | Carmarthenshire | Wales | 1 | 1 | 1 | 2 | 4 | 300% |
| 3 | Cambridgeshire | East of England | 2 | 5 | 5 | 7 | 7 | 250% |
| 4 | Gloucestershire | South West | 1 | 3 | 5 | 4 | 3 | 200% |
| 4 | North Somerset | South West | 1 | 1 | 1 | 0 | 3 | 200% |
| 4 | Ealing | London | 1 | 0 | 0 | 0 | 3 | 200% |
| 7 | Lincolnshire | East Midlands | 4 | 2 | 9 | 4 | 9 | 125% |
| 8 | Cheshire East | North West | 2 | 1 | 6 | 2 | 4 | 100% |
| 8 | Rhondda Cynon Taf | Wales | 1 | 5 | 2 | 3 | 2 | 100% |
| 8 | Perth and Kinross | Scotland | 1 | 2 | 1 | 3 | 2 | 100% |
| 8 | Doncaster | Yorkshire and The Humber | 1 | 1 | 1 | 1 | 2 | 100% |
| 8 | Kingston upon Hull, City of | Yorkshire and The Humber | 1 | 0 | 3 | 0 | 2 | 100% |
| 8 | Bury | North West | 1 | 1 | 0 | 0 | 2 | 100% |
| 8 | Aberdeenshire | Scotland | 1 | 1 | 0 | 0 | 2 | 100% |
| 8 | Derby | East Midlands | 1 | 0 | 0 | 0 | 2 | 100% |

Next, we wanted to compare defective tyres to other vehicle defects that cause vehicle collisions, again looking at the years between 2019 and 2023. Over these five years, 6,762 collisions were attributed to vehicle defects.
| Rank | Contributory factor reported in collision | 2019 | 2020 | 2021 | 2022 | 2023 | Total | % of vehicle defect collisions |
| 1 | Defective brakes | 517 | 470 | 558 | 570 | 553 | 2,668 | 39% |
| 2 | Tyres are illegal, defective, or under-inflated | 402 | 357 | 347 | 366 | 384 | 1,856 | 27% |
| 3 | Defective steering or suspension | 191 | 180 | 189 | 213 | 211 | 984 | 15% |
| 4 | Defective lights or indicators | 129 | 145 | 144 | 133 | 138 | 689 | 10% |
| 5 | An overloaded or poorly loaded vehicle or trailer | 109 | 90 | 117 | 101 | 95 | 512 | 8% |
| 6 | Defective or missing mirrors | 12 | 9 | 11 | 10 | 11 | 53 | 1% |

Illegal, defective, or under-inflated tyres were the leading vehicle defect in one in three local authorities nationwide. Looking more closely, some local authorities saw tyre defects responsible for most or all vehicle defect collisions.
| Rank | Local authority | Region | Collisions caused by illegal, defective, or under-inflated tyres | Total collisions caused by vehicle defects | Vehicle-defect collisions that were tyre-related |
| 1 | East Ayrshire | Scotland | 4 | 4 | 100% |
| 2 | Bridgend | Wales | 5 | 7 | 71% |
| 3 | Thurrock | East of England | 11 | 16 | 69% |
| 4 | Merthyr Tydfil | Wales | 8 | 12 | 67% |
| 4 | Midlothian | Scotland | 2 | 3 | 67% |
| 4 | North Tyneside | North East | 2 | 3 | 67% |
| 4 | Tameside | North West | 6 | 9 | 67% |
| 8 | North Ayrshire | Scotland | 4 | 7 | 57% |
| 9 | Argyll and Bute | Scotland | 6 | 11 | 55% |
| 10 | Dumfries and Galloway | Scotland | 10 | 19 | 53% |
| 10 | Newport | Wales | 10 | 19 | 53% |
| 12 | Falkirk | Scotland | 1 | 2 | 50% |
| 12 | Monmouthshire | Wales | 6 | 12 | 50% |
| 12 | Moray | Scotland | 1 | 2 | 50% |
| 12 | Neath Port Talbot | Wales | 5 | 10 | 50% |
| 12 | Orkney Islands | Scotland | 2 | 4 | 50% |
| 12 | Perth and Kinross | Scotland | 9 | 18 | 50% |
| 12 | Rhondda Cynon Taf | Wales | 13 | 26 | 50% |
| 12 | South Tyneside | North East | 1 | 2 | 50% |
| 12 | Stirling | Scotland | 2 | 4 | 50% |

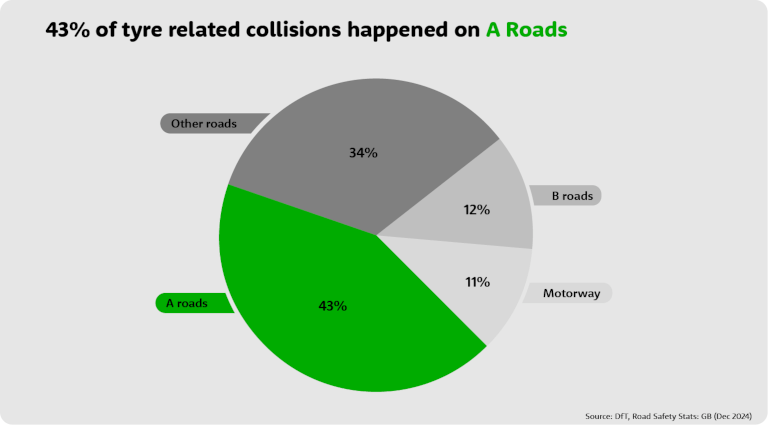
Collisions caused by faulty tyres were most common on A roads, which accounted for 802 collisions, or 43% of the total. This makes them the most hazardous road type for tyre-related defects, likely due to higher speeds and frequent use.
‘Other roads’ — including minor or unclassified roads — ranked second, with 628 collisions (34%). This shows that while these roads may carry less traffic, tyre-related incidents remain a concern.
B roads recorded 231 collisions (12%), while motorways, despite being associated with higher speeds, saw the fewest tyre-related collisions at 195 (11%). This may be due to better road quality or more regular maintenance.
| Collisions due to illegal, defective, or under-inflated tyres | ||||||||
| Rank | Road type | 2019 | 2020 | 2021 | 2022 | 2023 | Total | Percentage |
| 1 | A roads | 167 | 148 | 165 | 161 | 161 | 802 | 43% |
| 2 | Other roads | 148 | 117 | 111 | 114 | 138 | 628 | 34% |
| 3 | B roads | 41 | 48 | 42 | 53 | 47 | 231 | 12% |
| 4 | Motorway | 46 | 44 | 29 | 38 | 38 | 195 | 11% |
| All roads | 402 | 357 | 347 | 366 | 384 | 1,856 | 100% | |
We’ve also looked at MOT test data to see what defects are most likely to cause a car to fail, and how tyres rank.
| Rank | Defect category | Defects reported as dangerous as a percentage of all tests | Dangerous defects as a percentage of all dangerous defects | Major defects as a percentage of all tests | Major defects as a percentage of all major defects |
| 1 | Lamps, reflectors, and electrical equipment | 0.15% | 1.35% | 11.11% | 29.62% |
| 2 | Suspension | 0.51% | 5.34% | 8.73% | 22.22% |
| 3 | Brakes | 2.64% | 29.12% | 5.11% | 13.96% |
| 4 | Tyres | 4.83% | 59.78% | 1.82% | 3.60% |
| 5 | Visibility | 0.01% | 0.12% | 4.74% | 9.67% |
| 6 | Body, chassis, structure | 0.19% | 1.91% | 3.32% | 7.15% |
| 7 | Noise, emissions, and leaks | 0.03% | 0.30% | 3.13% | 6.70% |
| 8 | Steering | 0.10% | 0.99% | 1.80% | 3.66% |
| 9 | Seat belts and supplementary restraint systems | 0.03% | 0.34% | 0.99% | 1.94% |
| 10 | Identification of the vehicle | 0% | 0% | 0.36% | 0.76% |
| 10 | Road wheels | 0.07% | 0.75% | 0.30% | 0.69% |
| 12 | Seat belt installation check | 0% | 0% | 0.01% | 0.01% |
| 13 | Speedometer and speed limiter | 0% | 0% | 0.00% | 0.01% |

Nyo Logan, a Blackcircles.com tyre expert, explains why it’s essential to check your tyres before driving and how to check a vehicle's tyres:
“Tyres are the only part of your vehicle that make contact with the road, so their condition has a significant impact on your safety. Worn, damaged, or underinflated tyres can increase braking distances, reduce grip, and raise the risk of blowouts - especially in poor weather.
“Illegal, defective, or underinflated tyres contribute to hundreds of UK road collisions yearly. They can also result in fines of up to £2,500 and three penalty points per tyre if found to be below legal standards. Here’s what to check:
“Regular tyre checks take only a few minutes but can save lives. It’s a simple habit that helps prevent accidents, protects your wallet, and keeps you on the right side of the law.”
Data on the number of collisions due to tyres that are illegal, defective, or under-inflated over the last five years and the most dangerous vehicle defects by number of collisions were sourced from the Department for Transport’s
road safety statistics: data tables ( RAS0701: Collisions, casualties and road user type).
Data on the number of collisions due to illegal, defective, or underinflated tyres by road type were also taken from the same source.
Data on the proportion of MOTs that fail due to tyre defects and the percentage of these defects listed as dangerous was sourced from the Driver and Vehicle Standards Agency’s MOT testing data for Great Britain.

We love to hear from our customers. Connect with us today and let’s start a conversation.